


Mastering the Cash Flow Statement Format in Excel
It’s easy to get lost in a sea of spreadsheets, but a well-built cash flow statement in Excel cuts through the noise. It breaks your business’s financial health down into three simple, digestible parts. By organizing every dollar that moves into and out of your company, you get a real-time picture of your liquidity that an income statement alone just can’t provide.
Why Your Business Needs to Master Excel Cash Flow Statements
Profit on your income statement feels great, but here’s the hard truth: profit doesn’t pay the bills. Cash does. This is the fundamental reality that makes mastering a cash flow statement a non-negotiable skill for any serious business owner. It’s the essential bridge between the accrual-based world of accounting and the cash-based reality of your bank account.

I’ve seen it happen countless times with growing service businesses. On paper, they look like they’re crushing it—plenty of signed contracts and impressive revenue figures. Yet, every month is a nail-biting scramble to make payroll. A properly structured cash flow statement would immediately flag this issue, showing a healthy net income but a dangerously negative cash flow from operations, all because of slow-paying clients.
The Three Pillars of Cash Flow
In the world of finance, the cash flow statement is one of the three core documents—right alongside the balance sheet and income statement—that every business needs. It’s not just for big public companies; it’s a critical tool for service businesses looking to turn chaotic books into a strategic advantage. For a deeper dive into the fundamentals, check out these cash flow statement essentials from Sage.com.
Let’s quickly break down the three main sections of the statement. Think of them as the three pillars supporting your company’s financial health.
The Three Pillars of Cash Flow
| Section | What It Measures | Common Examples for a Service Business |
|---|---|---|
| Operating Activities | Cash generated by your core business operations. This is the engine room. | Collecting payments from clients, paying salaries, paying rent, and covering office expenses. |
| Investing Activities | Cash used to buy or sell long-term assets to help the business grow. | Buying new laptops for the team, purchasing office furniture, or selling an old company vehicle. |
| Financing Activities | Cash from interactions with owners and lenders. This tells your funding story. | Taking out a business loan, an owner contributing capital, repaying loan principal, or an owner taking a draw. |
Each of these pillars tells a different, but equally important, part of your financial story. Together, they give you a complete picture of where your cash is truly coming from and where it’s going.
A common mistake is thinking the income statement tells the whole story. A profitable business can easily fail from a cash shortage. The cash flow statement is your early warning system, showing precisely where your money is going and where it’s coming from.
Throughout this guide, we’re going to demystify the two main ways to build this statement: the direct and indirect methods. They might sound complex, but I’ll show you how to construct both in a clear, manageable way. My goal is to turn what seems like a daunting accounting task into your most powerful tool for making smart, confident financial decisions.
Building Your Excel Workbook for Accuracy
Before you even think about the formulas, let’s talk about the foundation. A reliable cash flow statement format in excel starts with a well-organized workbook. I can’t tell you how many times I’ve seen hours wasted hunting down errors that all started with a messy, disorganized file. The goal here is a clean, interconnected system where your data flows logically from one statement to the next.
The best way to do this is to give each component its own space. Structure your workbook with dedicated tabs—this simple step prevents so much clutter and makes the model intuitive for you or anyone else on your team to pick up.
You’ll want to start by creating four essential tabs in your Excel file:
- Income Statement: This is where all your revenue and expense data for the period will live.
- Balance Sheet: This tab will hold your assets, liabilities, and equity for both the current and prior periods.
- Cash Flow Statement: This is the final report, where everything comes together. It will pull data from the other tabs.
- Schedules: Think of this as your scratchpad for supporting calculations, like changes in working capital or fixed asset schedules. It keeps your main statements clean and easy to read.
Setting Up for Clarity and Error Prevention
With your tabs in place, the next step is formatting for pure usability. One of the simplest yet most effective techniques I use is color-coding cells. It’s a visual cue that can stop you from making a catastrophic error, like accidentally typing a number over a critical formula.
I recommend adopting a consistent color scheme. A common and highly effective method is:
- Blue Text: Use this for all manual input cells. These are the “hard-coded” numbers you type in yourself, like historical sales figures or a one-time expense.
- Black Text: Reserve this for all formula-driven cells. This formatting immediately tells you, “Don’t touch! This value is calculated automatically.”
This approach gives you an instant visual map of your model. When it’s time to update your financials for a new month, you know to only change the blue cells. This preserves the integrity of your formulas and saves you the massive headache of rebuilding broken links.
Dynamically Linking Your Financial Statements
The real magic of a great cash flow statement format in excel is in the dynamic linking. Your three core statements aren’t separate documents; they’re interconnected parts of your company’s financial story. Manually copying and pasting numbers between sheets is not only slow, it’s a guaranteed way to introduce mistakes.
Instead, you need to link them with formulas. For instance, the Net Income line at the top of your Cash Flow Statement (when using the indirect method) should never be a typed number. It should be linked directly to the final Net Income cell on your Income Statement tab.
A simple formula like =’Income Statement’!C25 does the trick, assuming ‘C25’ is the cell with your net income figure.
Likewise, every balance sheet account you reference in your cash flow statement—like Accounts Receivable, Inventory, and Accounts Payable—has to be linked directly to your Balance Sheet tab. This ensures that any update to your balance sheet automatically ripples through to your cash flow calculations, keeping everything perfectly in sync.
Getting this structure right is just as critical as setting up a proper chart of accounts for your bookkeeping. If you’re building your financial system from the ground up, you might find our guide on how to create a chart of accounts helpful.
Pro Tip: Always build a “check” formula at the bottom of your model. A simple calculation like
[Ending Cash on Cash Flow Statement] - [Ending Cash on Balance Sheet]should always result in zero. If it doesn’t, you know right away you have an error to track down.
Creating an Indirect Method Cash Flow Statement
Alright, let’s roll up our sleeves and build the most common type of cash flow statement. The indirect method is the go-to for the vast majority of businesses, and for good reason. It clearly shows how your net income—what you earned—actually turns into cash in the bank. This is where a proper cash flow statement format in Excel really proves its worth.
We’ll start with the engine room of your business: Cash Flow from Operating Activities. This section tells the story of how much cash your core, day-to-day operations are generating or using.
Starting with Net Income
The entire indirect method hinges on one number: Net Income. This is the bottom line pulled directly from your Income Statement. The most important rule here is to never manually type this number into your cash flow statement. Always link to it.
In the very first line of your “Cash from Operating Activities,” you’ll use a simple formula like =’Income Statement’!C25. This assumes your net income is sitting in cell C25 on your “Income Statement” tab. By linking the cells, you guarantee that any change to your revenue or expenses automatically updates here, keeping your entire financial model in sync.
This is the foundational step for bridging the gap between accrual-based profit and actual cash. If you want to dive deeper into the mechanics, you can read more about the accrual to cash adjustment process in our other guide.
Adjusting for Non-Cash Expenses
Once you’ve linked your net income, the next step is to add back any expenses that hit your income statement but didn’t actually involve cash leaving your wallet. These non-cash charges reduce your net income on paper, but your bank account balance didn’t change.
The classic example, especially for a service business, is Depreciation. You might have an expense for the depreciation of company laptops or office furniture. While it’s a real accounting expense, you didn’t write a check for it during that period.
To undo its impact on net income, you simply add the depreciation amount back. Other common non-cash items include:
- Amortization: Think of it as depreciation for intangible assets like software or patents.
- Stock-Based Compensation: If you pay employees with stock options, it’s an expense that doesn’t use cash.
- Gains or Losses on Asset Sales: These pop up here but are ultimately handled in the investing section, so we need to reverse their effect on net income.
Building this out in Excel is a logical flow: set up your statements, link them together, and then format everything to make it clear and error-free.
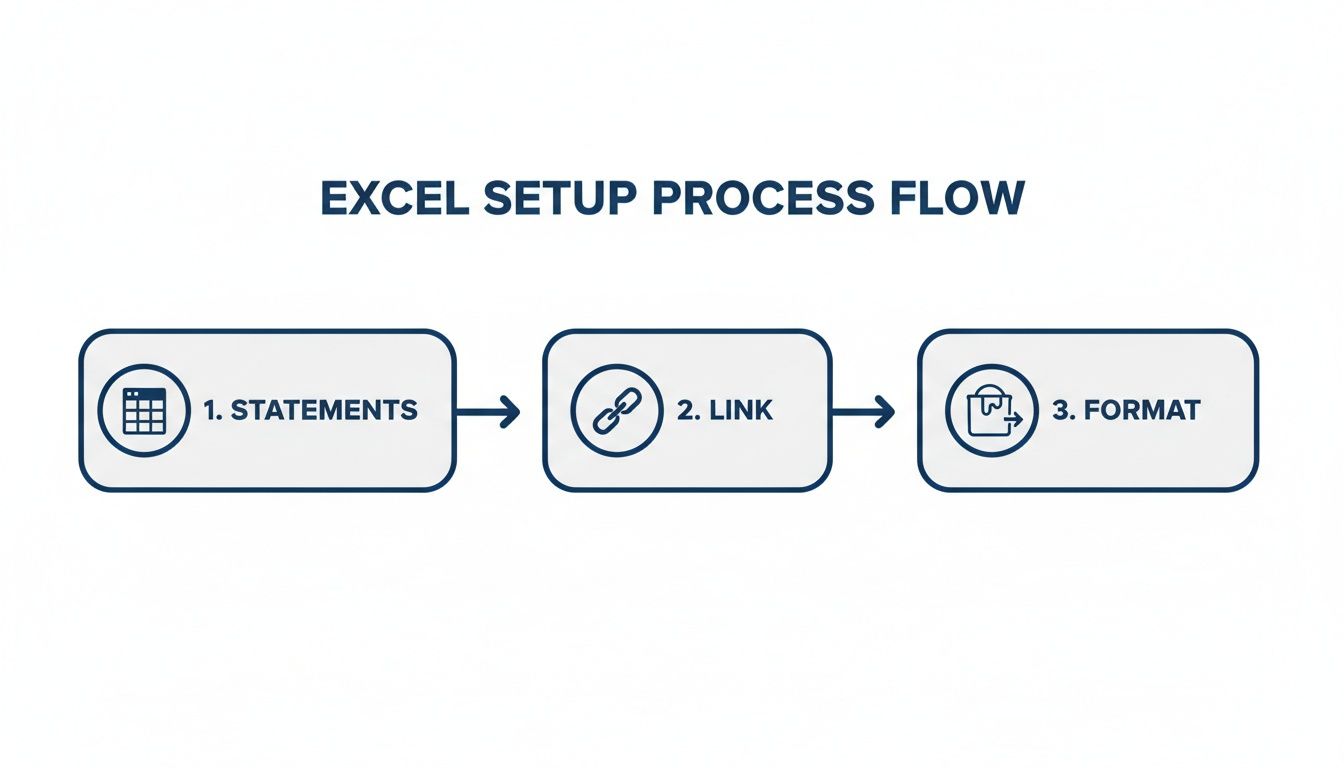
This workflow is key—get the statements right, link them with formulas, and apply smart formatting to catch any mistakes.
Calculating Changes in Working Capital
This is the part that trips a lot of people up, but the concept is simple once it clicks. We’re looking at the changes in your short-term operating assets and liabilities from the balance sheet—things like Accounts Receivable (A/R) and Accounts Payable (A/P).
You need to calculate the change in these accounts from one period to the next. For instance, in your working capital schedule tab, the formula for the change in A/R would be something like =BS_Current!C5 - BS_Prior!C5, assuming C5 is where your A/R balance lives.
Now for the golden rule on how these changes affect your cash flow:
- An increase in an asset is a USE of cash (negative). If your A/R went up, it means customers owe you more money. That’s cash you haven’t collected yet.
- A decrease in an asset is a SOURCE of cash (positive). If A/R went down, you collected more cash than the revenue you booked.
- An increase in a liability is a SOURCE of cash (positive). If your A/P went up, you held onto cash instead of paying your suppliers immediately.
- A decrease in a liability is a USE of cash (negative). If A/P went down, you paid your bills, which used up cash.
Key Takeaway: Always ask yourself: what was the direct impact on my bank account? If a change meant less cash in the bank than there would have been otherwise, it’s a negative adjustment. If it meant more cash, it’s positive.
Accounting for Investing and Financing Activities
After you nail down your “Net Cash from Operating Activities,” the next two sections are usually much more straightforward.
Cash Flow from Investing Activities is all about the cash used to buy or sell long-term assets.
- Purchase of Equipment: Bought a new server for $5,000? That’s a -$5,000 cash outflow.
- Sale of Assets: Sold an old company car for $10,000? That’s a +$10,000 cash inflow.
Cash Flow from Financing Activities covers cash movements between the company and its owners or lenders.
- Loan Proceeds: If you took out a $25,000 bank loan, that’s a +$25,000 inflow.
- Loan Repayments: Making a $2,000 principal payment on that loan is a -$2,000 outflow. (Important: The interest portion is an operating activity, not financing).
- Owner Draws/Contributions: An owner taking a $3,000 draw is a -$3,000 outflow, while putting capital in is an inflow.
Tying It All Together
Here comes the moment of truth. Sum up the net cash from all three sections—operating, investing, and financing. This gives you the Net Increase/Decrease in Cash for the period.
Take that number and add it to your Beginning Cash Balance (which you’ll pull from the prior period’s balance sheet).
The result is your Ending Cash Balance. This final number must perfectly match the cash balance sitting on your current period’s balance sheet. If it ties out, congratulations—your statements are balanced and your cash flow statement format in Excel is working perfectly.
Using the Direct Method for Deeper Cash Insights
While the indirect method is the go-to for most companies, largely because it clearly ties net income back to cash, the direct method offers a much more granular, unfiltered look at your cash movements. It answers a fundamentally different question. Instead of “why doesn’t my profit equal my cash?” it asks, “where did my cash actually come from, and where did it go?“
This approach provides deep operational insights that can sometimes get lost in the adjustments of the indirect method. You’re not starting with an accrual-based number like Net Income and working backward; you’re looking at the raw cash transactions within your operations. It’s like looking directly at your bank statement activity, but neatly organized into critical business categories.
Interestingly, although it’s less common in practice, the Financial Accounting Standards Board (FASB) actually encourages using the direct method. Why? Because it provides more useful, real-world information for making decisions. Seeing the exact cash collected versus the revenue you booked can instantly spotlight problems with your collections process.
Calculating Cash Collected From Customers
The first, and usually largest, line item you’ll tackle in a direct method statement is Cash Receipts from Customers. This isn’t just your revenue figure pulled from the income statement. It’s that revenue figure adjusted for the change in your customer IOUs—your Accounts Receivable.
The formula is pretty straightforward:
Cash Receipts from Customers = Sales Revenue – Increase in Accounts Receivable (or + Decrease in Accounts Receivable)
Imagine you booked $100,000 in revenue, but your Accounts Receivable balance grew by $15,000 over the same period. This means you only actually collected $85,000 in cold, hard cash. That other $15,000 is profit on paper, sure, but it’s still sitting in your customers’ bank accounts, not yours. This one calculation is a powerful diagnostic for the health of your sales-to-cash cycle.
Determining Cash Paid to Suppliers and for Expenses
Next up, you have to figure out all the cash that went out the door for operations. This is usually broken down into two main buckets: cash paid to suppliers for inventory and goods, and cash paid for operating expenses like salaries, rent, and utilities.
- Cash Paid to Suppliers: This calculation starts with the Cost of Goods Sold (COGS) from your income statement and then gets adjusted for changes in both your Inventory and Accounts Payable balances.
- Cash Paid for Operating Expenses: For this, you’ll start with your SG&A (Selling, General & Administrative) expenses and adjust for changes in things like prepaid expenses and accrued liabilities.
The logic here is similar to the customer receipts calculation. If your Accounts Payable went up, it means you held onto your cash longer, effectively getting a short-term loan from your suppliers. If it went down, you paid off old bills, which was a use of cash.
Modern Excel cash flow templates have made these multi-step calculations much more manageable. Many free downloads now include features like three-year tracking that precisely connects the income statement to the balance sheet. For instance, a 3-Year template might show $2.5M in customer cash receipts minus $1.8M in supplier payments, netting $700,000 from operations, while also tracking -$400,000 in capital expenditures and a $300,000 equity raise. You can explore how these detailed models work and discover more insights about cash flow modeling from CFI.
Reconciling the Direct and Indirect Methods
Here’s the most important check for your cash flow statement format in Excel: the final “Net Cash from Operating Activities” number must be exactly the same whether you use the direct or indirect method. They are just two different roads leading to the same destination.
The investing and financing sections of the cash flow statement are identical regardless of the method you choose. The only difference is in how you present the story of your operating activities.
I highly recommend building both statements in parallel tabs in your Excel workbook. This creates a powerful self-checking mechanism. If the operating cash flow numbers don’t match, you know immediately there’s an error in one of your calculations. It’s a clear signal to go back and troubleshoot your model before you make any critical business decisions based on that data.
Troubleshooting Common Excel Cash Flow Errors
There’s nothing quite like the sinking feeling you get when your cash flow statement just won’t balance. You’ve spent hours linking cells, checking formulas, and pulling data, yet the ending cash balance on your statement stubbornly refuses to match the cash line on your balance sheet.
It’s a frustrating moment, but it’s practically a rite of passage for anyone building a cash flow statement format in excel. The good news is that the error is almost always one of a few common, fixable mistakes.

Nine times out of ten, the problem is an incorrect sign on a working capital adjustment. It’s an easy slip-up because the logic can feel backward at first. For example, an increase in Accounts Receivable looks good on the surface—it means more sales! But from a pure cash perspective, it’s a negative adjustment because you haven’t collected that money yet.
Your Diagnostic Checklist for Balancing Issues
When things don’t tie out, the temptation is to start randomly changing formulas. Don’t do it. A methodical approach will save you a ton of time and prevent you from accidentally creating new problems.
Instead, work your way through this practical checklist:
- Check the Signs: Go line-by-line through your working capital changes. The golden rule is this: an increase in an asset is a cash outflow (negative sign), while an increase in a liability is a cash inflow (positive sign).
- Verify All Balance Sheet Changes: Did you account for the change in every single non-cash balance sheet account? It’s really easy to miss a smaller account like Prepaid Expenses or Accrued Liabilities.
- Confirm Your Net Income Link: Make sure your starting Net Income is linked directly to your Income Statement tab. It should be a cell reference, not a number you typed in manually.
- Review Investing and Financing: Double-check that you haven’t mixed up your activities. A common mistake is misclassifying loan payments—the principal repayment is a financing outflow, but the interest payment is an operating outflow.
These meticulous checks are the foundation of accurate financial reporting. If you want to dig deeper into this kind of detailed verification, our guide on how to reconcile bank accounts covers similar principles.
From Historical Report to Forward-Looking Tool
Once you’ve nailed the troubleshooting and your historical cash flow statement balances perfectly, you can unlock its real strategic value: forecasting. By building out a pro forma version, you transform a backward-looking report into a powerful tool for making decisions. It allows you to plan for major future expenses, see seasonal cash dips coming, and decide with confidence when to invest in growth.
Pro forma cash flow statements in Excel have become indispensable for forecasting, especially for scaling companies that need to look ahead 60 months or more. For instance, a startup’s forecast might detail specific inflows like a $500,000 seed investment, a projected net income of $250,000, and a 15% growth in accounts payable that adds $180,000 to the cash pool. These detailed models help businesses map out their financial future with much greater clarity.
The ultimate goal of building a cash flow statement isn’t just to report on the past; it’s to gain the clarity needed to shape the future. A balanced, accurate model gives you the foresight to steer your business proactively instead of reacting to financial surprises.
The best part is that you don’t have to start from scratch. You can simply extend your existing model by adding new columns for future months or years. From there, you’ll replace historical data with your assumptions for things like revenue growth, expense changes, and planned capital expenditures. This is where your mastery of the cash flow statement format in excel truly pays off.
Answering Your Cash Flow Statement Questions
Once you’ve put in the work to build your cash flow statement in Excel, a few practical questions almost always come up. It’s one thing to get the numbers to line up; it’s another to really understand the story they’re telling. Let’s tackle the most common questions we hear from business owners so you can use this new tool with confidence.
What Is the Real Difference Between Profit and Cash Flow?
This is probably the most important concept to get right. Profit, the bottom line on your income statement, is the story of your business’s performance on paper—and it includes non-cash items like depreciation. Cash flow, on the other hand, is the hard reality of money moving in and out of your bank account.
Think about it this way: a business can look incredibly profitable but still go under if its customers don’t pay their invoices on time. That creates a cash crunch where you have real bills to pay (like payroll and rent) but no actual cash to pay them with. The cash flow statement is the essential bridge that connects those two worlds, showing you the true liquidity of your company.
Why Won’t My Cash Flow Statement Balance?
We’ve all been there. The frustration of an unbalanced statement is a universal feeling for anyone who’s ever built one. When your ending cash balance doesn’t match the cash on your balance sheet, it almost always comes down to a few common culprits.
Before you tear your hair out, check these three things first:
- Incorrect Signs: Did you accidentally use the wrong sign for a change in an asset or liability? Remember, an increase in an asset like Accounts Receivable is a negative cash adjustment because you haven’t collected that money yet.
- Missing Accounts: Did you forget to include a change in a balance sheet item? Every single non-cash account on your balance sheet has to be accounted for somewhere on the cash flow statement.
- Mismatched Net Income: Does the net income figure at the very top of your cash flow statement perfectly match the bottom line of your income statement?
Your first diagnostic step should always be to check that [Beginning Cash + Net Change in Cash] equals your Ending Cash balance.
This reconciliation isn’t just an accounting chore; it proves the integrity of your entire financial model. A statement that balances is a statement you can trust to make critical business decisions.
Should My Service Business Use the Direct or Indirect Method?
For almost every service-based business out there, the indirect method is the way to go. It’s much simpler to put together because it starts with Net Income—a number you already have from your income statement—and reconciles it back to your cash position. This approach clearly shows how your reported profit actually converts (or fails to convert) into real cash.
While the direct method provides a more detailed breakdown of cash receipts and payments, it’s usually more work than it’s worth for internal analysis. The indirect method is the standard for both internal management reports and external financial statements, making it the most practical choice by far.
How Often Should I Update My Cash Flow Statement?
At the absolute minimum, you should be updating and reviewing your cash flow statement monthly. This should be a standard part of your month-end financial closing process. A monthly review is frequent enough to help you spot developing trends, manage your working capital, and make adjustments before small issues become big problems.
However, if your business is in a high-growth phase, managing tight margins, or heading into a major project, running a weekly cash flow forecast can be the difference between proactive management and reactive crisis control. The more dynamic your business is, the more often you need to have a pulse on your cash.
At Steingard Financial, we help service businesses transform confusing financial data into clear, actionable insights. If you’re ready to move beyond spreadsheets and gain true confidence in your numbers, let’s talk about building a scalable financial back office. Learn more at Steingard Financial.