

Chart of Accounts Accounting Definition A Guide for Service Businesses
If you want a simple chart of accounts accounting definition, here it is: the COA is a complete list of every single account in your financial system. But it’s so much more than a list. It’s the organizational backbone for your company’s finances, making sure every transaction lands in the right bucket.
What Is a Chart of Accounts in Accounting?
Picture your business finances as a massive, sprawling library. Every transaction—a client payment, a software subscription, a coffee run for the team—is a book. Without a solid cataloging system, finding anything would be a nightmare. The chart of accounts (COA) is that essential catalog.

It’s the fundamental structure that takes every dollar coming in and going out and sorts it into a specific, logical category. This financial blueprint is what turns a chaotic pile of receipts and invoices into information you can actually use.
The Five Pillars of Your Financial Structure
Every chart of accounts, no matter how simple or complex, is built on five core account types. These are the universal building blocks of accounting and the direct source for your main financial statements. Getting a handle on these is the first step to true financial clarity.
Here’s a quick breakdown of what they are and what they mean for a typical service business.
| The Five Pillars of Your Chart of Accounts | ||
|---|---|---|
| Account Type | Definition (What It Represents) | Common Examples for a Service Business |
| Assets | The resources your business owns that have tangible value. | Cash in your checking account, accounts receivable (invoices clients owe you), company computers. |
| Liabilities | What your business owes to others. Think of these as financial obligations. | Credit card balances, business loans, accounts payable (bills you need to pay your vendors). |
| Equity | The net worth of your business. It’s what’s left over after you subtract liabilities from assets. | Owner’s investment (the cash you put in), retained earnings (profits you’ve reinvested). |
| Revenue | All the money your business earns from providing its services. | Project fees, consulting income, monthly retainers, sales of digital products. |
| Expenses | The costs you incur to run your business and generate revenue. | Payroll, software subscriptions (SaaS), marketing ads, rent for your office, professional development. |
Understanding these five pillars is non-negotiable because they directly feed into your most critical financial reports—the balance sheet and the income statement.
Why This Structure Is So Important
A well-organized COA isn’t just about keeping your books tidy; it’s the engine for strategic insight.
It acts as the backbone of your entire accounting system, cataloging every account with a unique number or code. This makes tracking finances simple and consistent. More importantly, this setup is what generates your financial reports, giving you a clear, honest look at your company’s health.
Think of it this way: The Chart of Accounts is the ‘table of contents’ for your finances. The General Ledger, on the other hand, is the ‘book’ itself, containing the detailed story of every transaction.
Without this organized structure, trying to create an accurate report is like navigating without a map. You’re left guessing about your true profitability, your cash flow situation, and your overall financial standing—a risky way to run any business, especially one you want to grow.
Why Generic Chart of Accounts Templates Fail Service Businesses
Grabbing the default chart of accounts from software like QuickBooks is a bit like wearing a one-size-fits-all suit. Sure, it covers you, but it rarely fits well where it really counts. You’re often left with a distorted picture of your business’s financial health.
These templates are built for the masses, which means they completely miss the unique details of a service-based business. This generic approach almost always leads to messy books and strategic guesswork. It tends to lump all your hard-earned money into one or two vague income accounts and mixes your expenses into broad, unhelpful categories. The result? A financial report that tells you what you already know—money came in, and money went out—but offers zero insight into the why or the how.
The Problem with Vague Revenue Tracking
For any service business, it’s a simple truth: not all revenue is created equal. A generic template might just give you a single account called “Sales” or “Service Income.” This is a huge mistake because it treats a high-touch, multi-month consulting project the exact same way as a simple, recurring monthly retainer.
This lack of detail makes it impossible to answer basic, vital questions about your business:
- Which service line is actually my most profitable? Without separate income accounts for each service (like “Consulting Fees,” “Retainer Income,” and “Project-Based Fees”), you have no way to compare their performance.
- Are we pricing our projects correctly? If you can’t isolate the revenue from a specific type of project, you’re just guessing at its profit margin.
- Where should we focus our marketing dollars? Vague revenue data means you can’t see which services are truly driving growth.
A custom chart of accounts that’s built for your business involves creating specific, granular income accounts. This structure immediately shines a light on which parts of your business are thriving and which are lagging, turning your income statement from a simple summary into a strategic roadmap.
Inaccurate Expense and Cost of Goods Sold Allocation
The failure of generic templates isn’t just on the income side. For a service business, the primary “cost of goods sold” (COGS) isn’t physical materials; it’s things like direct labor, specific software licenses, and contractor fees tied directly to client work. A generic template just doesn’t have the right buckets for this.
A poorly structured COA is more than an inconvenience; it’s a financial liability. It forces you to make critical decisions based on incomplete or misleading information, which is a recipe for stalled growth and missed opportunities.
For instance, you might have a single, broad “Software” expense account. This mixes the cost of your internal project management tool with the cost of a specialized software license you bought just for one client’s project. One is an overhead cost; the other is a direct cost of delivering your service. Lumping them together completely skews your profitability analysis for that client.
A tailored COA lets you properly categorize these costs. By creating sub-accounts for direct project costs, you can accurately calculate the gross profit margin on every single project or client. This clarity is the key to understanding your true profitability and making informed decisions about pricing, who to hire, and even which clients to pursue.
How to Structure and Number Your Chart of Accounts
Moving away from a generic, out-of-the-box Chart of Accounts is like switching from a blurry photo to a high-definition image of your business finances. The key to getting that crystal-clear picture is a logical structure and a consistent numbering system.
This framework does more than just organize your accounts; it sets your business up for smart growth and deeper financial analysis.
The structure itself is surprisingly straightforward, following a universal accounting logic. Think of it like a grocery store—you know exactly where to find the produce, dairy, and baked goods because they’re grouped in a predictable way. Your COA works the same way, grouping accounts into five main categories, each with its own designated number range.
This simple organization ensures that anyone looking at your books—from your bookkeeper to a potential investor—can instantly understand the financial layout. It brings a standardized order to what could otherwise be a chaotic list of transactions.
Understanding the Standard Numbering Convention
Most accounting systems, including QuickBooks Online, use a standard numerical system to organize the five core account types. This isn’t just for neatness; the numbers are assigned in the same order that the accounts appear on your primary financial statements—the Balance Sheet and the Income Statement.
This alignment is incredibly powerful. It means your COA is already structured to build your reports for you, automatically. Here’s the typical breakdown:
- 1000–1999 Assets: Everything your business owns (cash in the bank, equipment, money owed to you).
- 2000–2999 Liabilities: Everything your business owes (credit card balances, loans, bills to be paid).
- 3000–3999 Equity: The net worth of the business (owner’s investment, retained earnings).
- 4000–4999 Revenue: The money you earn from your services.
- 5000–5999 Cost of Goods Sold (COGS): Direct costs tied to delivering your services.
- 6000–9999 Expenses: The operating costs of running your business (rent, marketing, software subscriptions).
For a growing service business, this structure provides critical financial visibility. Tiny classification errors, like miscoding an accounts payable entry (a 2000-series account) or a credit card transaction (another 2000-series account), can snowball. Over a year, these small mistakes can lead to 20-30% reporting inaccuracies.
The difference between a generic setup and a well-thought-out custom COA is night and day.
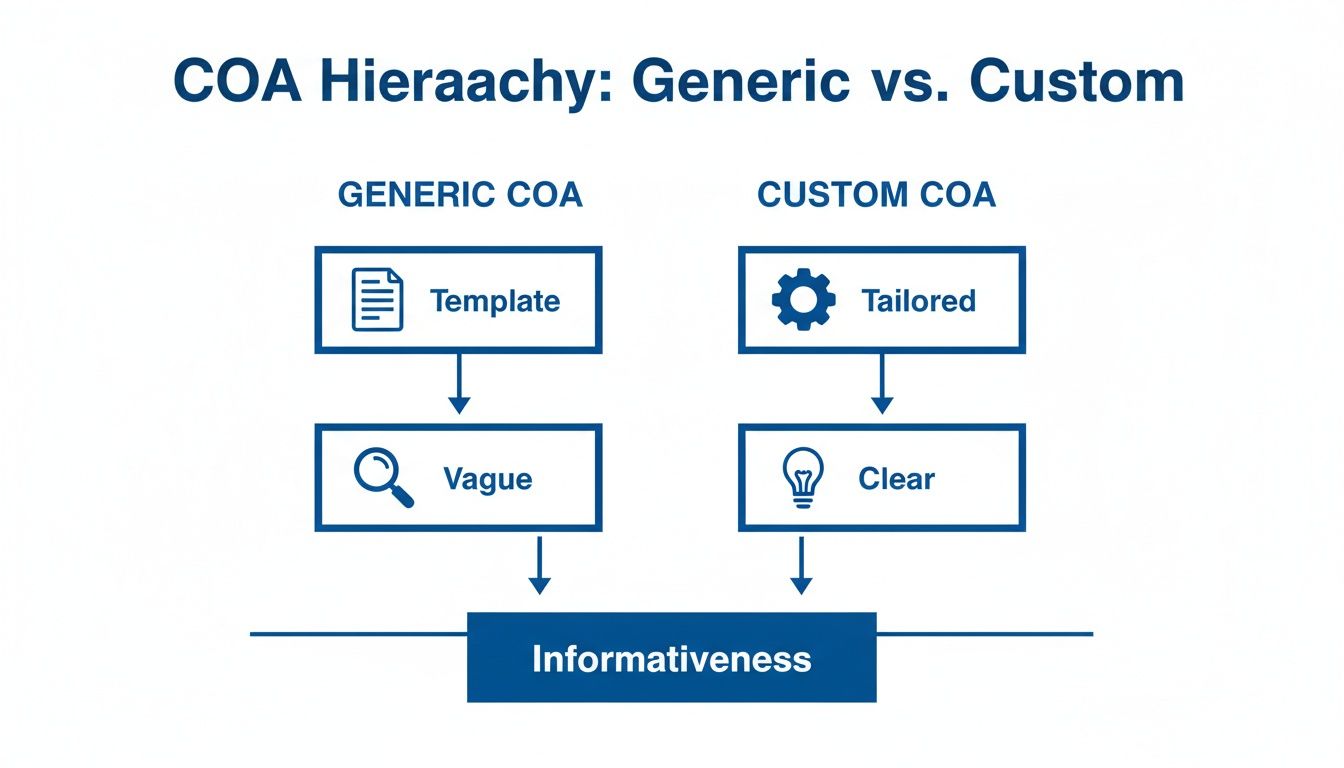
As you can see, a custom structure gives you information you can actually use, while a generic template often just creates confusion.
The Power of Parent and Sub-Accounts
The real magic happens when you start using parent accounts and sub-accounts to add layers of detail. This is where you transform your COA from a simple list into a powerful analytical tool. A parent account is a high-level category, while sub-accounts break it down into more specific pieces.
Instead of one vague “Revenue” account (4000), you can create a structure like this:
- 4000 Revenue (Parent Account)
- 4100 Consulting Services
- 4200 Monthly Retainers
- 4300 Implementation Projects
Immediately, you can see exactly where your money is coming from. Are retainers driving most of your income, or are one-off projects the real moneymakers? Your Profit & Loss statement will now answer that question at a glance.
The same logic applies to expenses. Don’t just settle for a single “Marketing” account. Break it down.
By using parent and sub-accounts, you’re not just tracking what you spend; you’re creating a system to understand the return on every dollar. This level of detail is fundamental for calculating key performance indicators (KPIs) and making data-driven decisions.
For example, a detailed expense structure might look like this:
- 7000 Marketing & Advertising (Parent Account)
- 7100 Digital Ads
- 7110 Google Ads
- 7120 LinkedIn Ads
- 7200 Content Marketing
- 7300 Conference & Events
This granular view helps you see which marketing channels are delivering results and which ones are just draining your budget. For practical steps on getting this set up, check out our guide on how to set up QuickBooks Online for service businesses. This hands-on approach provides a clear framework for building a COA that grows with your business, not against it.
Sample Chart of Accounts Numbering System for a Service Business
To bring this all together, here’s a sample numbering structure you can adapt for your own service business. This table shows how parent accounts and sub-accounts fit into the standard numbering ranges.
| Account Range | Account Type | Example Parent Account | Example Sub-Account |
|---|---|---|---|
| 1000s | Assets | 1010 Bank Accounts | 1011 Chase Checking |
| 2000s | Liabilities | 2010 Credit Cards | 2011 Amex Business Platinum |
| 3000s | Equity | 3200 Owner’s Equity | 3210 Owner’s Contribution |
| 4000s | Revenue | 4100 Service Revenue | 4110 Project Fees |
| 5000s | COGS | 5100 Contractor Costs | 5110 Freelance Writers |
| 6000s+ | Expenses | 7100 Marketing | 7110 Digital Advertising |
This is just a starting point, but it illustrates how a logical numbering system creates clarity and makes your financial data much more useful for day-to-day decisions.
Common COA Mistakes That Cost Businesses Money
A poorly organized chart of accounts isn’t just a small bookkeeping headache; it’s a real threat to your company’s financial health. Think of it as using a faulty GPS for your business—you might feel like you’re moving, but you’re probably headed in the wrong direction and burning through cash along the way.
These common mistakes often start out seeming harmless but can quickly snowball into serious financial problems. They hide the true performance of your services, make tax time a nightmare, and often lead to expensive cleanup projects that eat up both your time and money. Spotting and fixing them is one of the best things you can do for your business’s financial clarity.
The “Miscellaneous” Black Hole
One of the most frequent and damaging mistakes we see is relying on a vague “Miscellaneous” or “Ask My Accountant” expense account. It’s the financial version of a junk drawer, where transactions you aren’t sure about go to be forgotten. It might seem like a quick fix, but this habit creates a black hole in your financial data.
The issue is this single account could be hiding anything from a vital software subscription to a one-time client gift. When you don’t categorize expenses properly, you lose all visibility into where your money is actually going. This makes it impossible to manage a budget or spot areas where you might be overspending.
Creating Too Many Redundant Accounts
On the other side of the coin is the mistake of creating way too many accounts. It’s easy to fall into the trap of making a new expense account for every single vendor or a new income account for every slight variation of a service you offer. It feels organized at first, but it quickly leads to a bloated and confusing chart of accounts.
The goal of a COA is clarity, not complexity. A bloated chart of accounts with dozens of nearly identical accounts makes financial reports long, difficult to read, and ultimately, less useful for decision-making.
For example, there’s no need for separate expense accounts like “GoDaddy Hosting,” “WP Engine Hosting,” and “Cloudways Hosting.” A much cleaner way to handle this is to have one parent account called “Website Hosting” and simply code each vendor’s bill to it. This keeps your Profit & Loss statement clean and easy to read, while still letting you see the details when you need to.
Failing to Use Sub-Accounts for Granularity
Maybe the biggest missed opportunity of all is not taking advantage of sub-accounts. A “flat” chart of accounts—one with no parent-child relationships—only gives you a surface-level peek at your finances. It hides the critical details you need to make smart, strategic decisions.
Without sub-accounts, you’re missing out on key insights that could be driving your growth. Here are a few examples of what a flat structure hides:
- Vague Revenue: A single “Service Income” account tells you nothing about which of your services is the most profitable. Are your monthly retainers bringing in the real money, or is it your one-off consulting projects?
- Unclear Marketing ROI: Lumping everything into one “Marketing” expense account makes it impossible to see which channels are actually working. You can’t compare the return on your Google Ads spending versus your LinkedIn campaigns.
- Hidden Project Costs: If you put all your contractor fees into one account, you can’t calculate the gross profit margin for individual client projects to see which ones are actually worth it.
By not using sub-accounts, you are essentially flying blind. You end up making crucial decisions about where to invest your resources based on gut feelings instead of hard data.
The solution is to restructure your COA using a logical hierarchy. Grouping specific accounts under broader parent categories turns your financial statements from simple summaries into powerful tools for analysis. This strategic use of the chart of accounts accounting definition is what separates businesses that guess from businesses that know.
Turning Your COA into a Strategic Decision-Making Tool
A well-designed Chart of Accounts does more than just keep your transactions organized for tax season. It transforms your accounting system from a simple record-keeper into a powerful engine for business intelligence. This is where all that structural work you did pays off, directly fueling the financial reports that guide your most important decisions.

Think of your COA as the DNA of your financial statements. The specific accounts you create directly determine the level of detail and clarity you’ll see on your Income Statement and Balance Sheet. A vague COA produces vague reports, but a granular COA delivers sharp, actionable insights.
From Blurry Data to Strategic Clarity
Let’s look at a practical “before and after” scenario to really see this in action. Imagine a consulting firm using a generic, out-of-the-box COA.
Before: The Generic COA
The firm has one broad account for all its income, just called “Service Revenue.” It also has a single “Contractor Costs” account. When the owner looks at their monthly Profit & Loss statement, they see a total revenue number and a total contractor expense. The problem? They have no idea which service lines are actually profitable and which are just draining resources.
After: The Custom COA
Now, the firm implements a custom COA with specific sub-accounts:
- Revenue: Broken down into “Strategy Workshops,” “Monthly Retainers,” and “Implementation Projects.”
- Cost of Goods Sold (COGS): Separated into “Workshop Facilitator Fees” and “Project Contractor Fees.”
With this new structure, the P&L statement instantly reveals the gross profit margin for each distinct service. The owner can now clearly see that Strategy Workshops are highly profitable, but the Implementation Projects are barely breaking even after paying contractors. This is a game-changing insight that can drive pricing strategy, resource allocation, and marketing focus.
Fueling Your Most Important KPIs
This level of detail is absolutely essential for calculating the Key Performance Indicators (KPIs) that truly measure the health of your business. Your chart of accounts structure is the foundation for all of these critical metrics.
A well-built chart of accounts doesn’t just answer “what happened” with your finances; it equips you to answer “why it happened” and “what should we do next.” It turns historical data into a forward-looking guide.
With a custom COA, you can easily track critical KPIs such as:
- Gross Profit Margin per Service: Understand which offerings are your true moneymakers.
- Customer Acquisition Cost (CAC): By creating detailed marketing expense sub-accounts, you can see how much you’re really spending to win new clients.
- Revenue Concentration: See if you are overly reliant on a single service line or client type.
The granularity of your COA sets the upper limit on your financial analysis. If you don’t track expenses by department, for example, you can never accurately calculate profitability by department. This directly impacts strategic decisions and can affect the KPIs of 60% of growing companies.
To truly use your COA as a strategic tool, understanding frameworks like a decision tree template can help simplify complex choices based on the clear data your COA provides. This shift from reactive bookkeeping to proactive analysis is where a thoughtfully designed chart of accounts accounting definition truly comes to life. Our insights on financial reporting best practices can also provide valuable context.
Building Your Financial Blueprint with an Expert Partner
Think of your chart of accounts as the blueprint for your financial house. If that blueprint is drawn incorrectly—with misplaced walls or a shaky foundation—everything you build on top of it will be crooked and unstable. This guide has walked you through the basics of good financial architecture, from the chart of accounts accounting definition to the common pitfalls that can weaken the whole structure. Now, it’s time to build.
But knowing the theory is one thing; executing it flawlessly is a completely different ballgame. A generic or poorly planned COA doesn’t just look messy. It leads directly to confusing reports, metrics that don’t make sense, and expensive bookkeeping cleanups down the road. It creates friction in your business, slowing down growth and making you second-guess critical decisions about pricing, hiring, and overall strategy.
Take the Next Step with Confidence
You shouldn’t have to become a bookkeeping expert just to get the financial clarity you need to run your business. Instead of spending your valuable time wrestling with account numbers and confusing software settings, you can partner with a team that builds these financial blueprints every single day for service businesses just like yours. A professional ensures your setup isn’t just correct for today, but built to scale with you as you grow.
A custom-built chart of accounts is more than just good bookkeeping; it’s a strategic asset that provides the clear, reliable data you need to steer your business with confidence. It transforms accounting from a historical record into a forward-looking tool.
At Steingard Financial, we design and implement custom chart of accounts that deliver unflinching clarity and support sustainable growth. We don’t just follow a template; we build a financial back office that actually works for you, giving you the insights to make smarter, faster decisions.
Stop letting a disorganized financial system hold you back. Let us build the solid foundation you need to move forward with absolute confidence. Schedule a call with Steingard Financial today to discuss your business’s unique financial blueprint and build a back office that’s ready for whatever comes next.
Chart of Accounts: Your Questions Answered
As you get more comfortable with your business finances, you’re bound to have some questions about your chart of accounts. This isn’t a “set it and forget it” kind of tool; it’s a living, breathing part of your financial management. Let’s tackle some of the most common questions service business owners have.
Getting these answers will help you move from simply knowing what a chart of accounts is to actually using it to your advantage every day.
How Often Should I Review My Chart of Accounts?
Think of your COA as a living document, not something carved in stone. For it to be useful, it has to grow and change right along with your business.
A good rule of thumb is to give it a thorough review at least once a year. This annual check-in makes sure it still gives you a clear picture of how your business is running.
But you’ll want to review it more often if your business goes through a major change. For instance, you should revisit your COA if you:
- Launch a new service line: You’ll need new accounts for revenue and maybe even direct costs to see if that new service is actually profitable.
- Expand into a new region: This might call for separate accounts to track expenses or income by location, helping you see which markets are performing best.
- Take on a major business loan: This adds new liabilities to your books that have to be tracked correctly from day one.
Can I Change My Chart of Accounts Once It Is Set Up?
Absolutely. You can and should modify your COA after the initial setup. The key is to do it thoughtfully, not on a whim. Making impulsive changes can create a real mess in your historical reports.
Changing account names or, more importantly, account numbers can throw off your ability to make clean year-over-year comparisons. Suddenly, you can’t track performance trends because last year’s data doesn’t line up with this year’s new structure.
It’s helpful to remember the difference between the COA and the General Ledger. The Chart of Accounts is like the ‘table of contents’—a full list of every account you can use. The General Ledger is the ‘book’ itself—a detailed history of every single transaction that has happened in each of those accounts.
Because of these potential reporting headaches, it’s always a good idea to talk to an accounting professional before making big changes. They can help you map old accounts to new ones, ensuring a smooth transition that keeps your financial data clean and reliable. This simple step can save you hours of expensive cleanup down the road.
Are you ready to build a financial blueprint that gives you unflinching clarity and supports real growth? The team at Steingard Financial specializes in designing custom chart of accounts specifically for service businesses. Stop wrestling with confusing reports and let us build the financial back office you need to move forward with confidence. Learn more by visiting us at https://www.steingardfinancial.com.