

A Practical Guide to Budgeting and Forecasting for Service Businesses
For any service business, budgeting and forecasting aren’t just tedious financial chores; they’re the absolute foundation of your strategic roadmap. A budget is your game plan for how you’ll spend your money, while a forecast acts as your guide, predicting where that plan will take you so you can adjust on the fly.
Why Service Businesses Need a Financial Roadmap

Let’s be real—managing money in a service business is a completely different ballgame. You’re not selling widgets with a clear cost of goods sold. Your main assets are your people and their expertise. Revenue often comes in chunks tied to project phases or monthly retainers, and your biggest line item—payroll—is always shifting with new hires and client utilization.
This is exactly why a solid financial plan is non-negotiable.
When you operate without a financial roadmap, you’re basically driving with a blindfold on. You might look profitable one month but get hit with a surprise cash crunch the next. Or maybe you pass up on hiring a superstar because you weren’t confident you could actually afford them long-term. A good budget and a reliable forecast shift you from being reactive to being proactive.
From Guesswork to Strategic Decisions
Think of your budget as the blueprint for your business’s financial house. It lays out the spending boundaries and revenue goals you need to hit over the year. Your forecast, then, is your GPS. It tells you in real-time if you’re on the right path and helps you find a new route when you hit a roadblock.
For instance, a digital marketing agency can use its forecast to see a seasonal spike in client work coming up around the holidays. Knowing this, they can line up freelance help months ahead of time. This isn’t just about controlling costs; it’s about confidently grabbing opportunities to bring in more revenue without burning out the team.
This strategic thinking is even more critical when the economy gets choppy. In the European Union, for example, businesses are navigating a lot of uncertainty. The Spring 2025 Economic Forecast projects a modest real GDP growth of only 1.1% for the EU, partly due to unpredictable US trade policies. You can dive into the full economic analysis from the European Commission, but the takeaway is clear: sharp financial planning is essential to weather these kinds of trends.
A budget tells you what you can’t afford, but a forecast tells you what you can achieve. The combination gives you the confidence to make bold, calculated moves that drive growth.
The Real-World Benefits of Financial Clarity
Having a clear financial roadmap gives you more than just peace of mind. It has a direct, tangible impact on how you run a resilient and competitive business.
- Informed Investment: A consulting firm can look at its budget and forecast to pinpoint the perfect quarter to invest in new project management software, making sure the purchase lines up with expected cash flow.
- Strategic Staffing: By forecasting revenue based on what’s in your sales pipeline, you can build a staffing plan that avoids being short-handed during crunch time or overstaffed during slow periods.
- Improved Profitability: When you regularly compare your actual results to your budget, you quickly spot where you’re overspending. This lets you tighten up costs and protect your profit margins.
Ultimately, effective budgeting and forecasting turn your financial data from a backward-looking report card into a powerful tool for building the future. It’s all about gaining the clarity you need to handle challenges, jump on opportunities, and build a service business that’s truly built to last.
Gathering Your Financial Puzzle Pieces
Any solid budgeting and forecasting process starts with quality ingredients. Before you can map out where your business is going, you need a crystal-clear picture of where it’s been. This means taking the raw data from your day-to-day systems and turning it into something you can actually use for strategic planning.
For most service-based businesses, your financial story is primarily told through two platforms: QuickBooks for accounting and Gusto for payroll. Pulling the right information isn’t just a clerical task; it’s the absolute foundation for a reliable forecast. I can’t stress this enough: “garbage in, garbage out” is a harsh reality in financial modeling.
The whole point here is to gather enough historical data to see the patterns in your revenue, your cost of services, and your operating expenses. This history becomes the launchpad for every projection you’ll make.
Sourcing Your Core Financial Reports from QuickBooks
Your QuickBooks account holds the most important pieces of the puzzle. You’ll need to pull three key reports to get a full picture of your company’s financial health. I always recommend looking at the last 12-24 months of data; this gives you enough runway to spot seasonality and real growth trends.
Here are the non-negotiable reports to run:
- Profit & Loss (P&L) Statement: Think of this as your performance scorecard. It lines up your revenues and expenses over a period to show your net profit or loss.
- Balance Sheet: This is a snapshot of your business at a single moment in time. It lays out what you own (assets) and what you owe (liabilities), giving you a clear look at your company’s equity.
- Statement of Cash Flows: This report is critical. It shows how cash is actually moving through your business. Profit on a P&L doesn’t always mean cash in the bank, and this report tells the true story of your liquidity.
When you run these reports, make sure to filter them by month. A monthly view is essential for spotting trends—like that predictable dip in sales every August or the spike in software costs every January when annual subscriptions hit. These are the exact kinds of patterns you need to build into your forecast.
A quick but important aside: The accuracy of these reports is completely dependent on how well your transactions are categorized. A messy chart of accounts will spit out a messy P&L, making your forecast unreliable from the get-go.
This is why good bookkeeping isn’t just about being neat—it’s about creating a trustworthy source of truth for your most important decisions. If you’re just starting out, taking the time to understand how to create a chart of accounts is one of the most valuable things you can do for your business.
Extracting Payroll Data from Gusto
For any service business, people are your biggest asset and usually your largest expense. Gusto gives you incredibly detailed reports that break down these costs far beyond just a single “payroll” number. Getting into this detail is vital for accurate budgeting.
You’ll want to pull reports that clearly itemize these specific costs:
- Gross Salaries and Wages: The base pay for your entire team.
- Employer Payroll Taxes: This is your share of FICA (Social Security and Medicare) and unemployment taxes (FUTA/SUTA).
- Employee Benefits: The company’s portion of health insurance, retirement plans, and any other perks you offer.
- Workers’ Compensation: The cost of insuring your team against injuries on the job.
Breaking these out is crucial. Lumping everything into one “payroll” line item on your budget hides major cost drivers. For instance, planning a 5% salary increase also means your payroll tax burden will go up—a detail a precise forecast absolutely must capture. A key part of this is knowing how to calculate operating expenses for your business, which naturally includes these payroll specifics. This level of detail is what turns your budget from a rough guess into a powerful management tool.
Building Your First Financial Forecast Model
Alright, with your historical data pulled together, it’s time to roll up your sleeves and build your first forecast. This isn’t about getting lost in complex algorithms or needing a PhD in finance; it’s about creating a straightforward, powerful tool that uses your past performance to paint a realistic picture of what’s ahead. The real goal here is to move past a static, set-it-and-forget-it budget and build a dynamic model you can actually use to make smarter decisions.
This is all about a simple flow of information: taking clean data from your core systems like QuickBooks and Gusto and turning it into real, actionable insights.
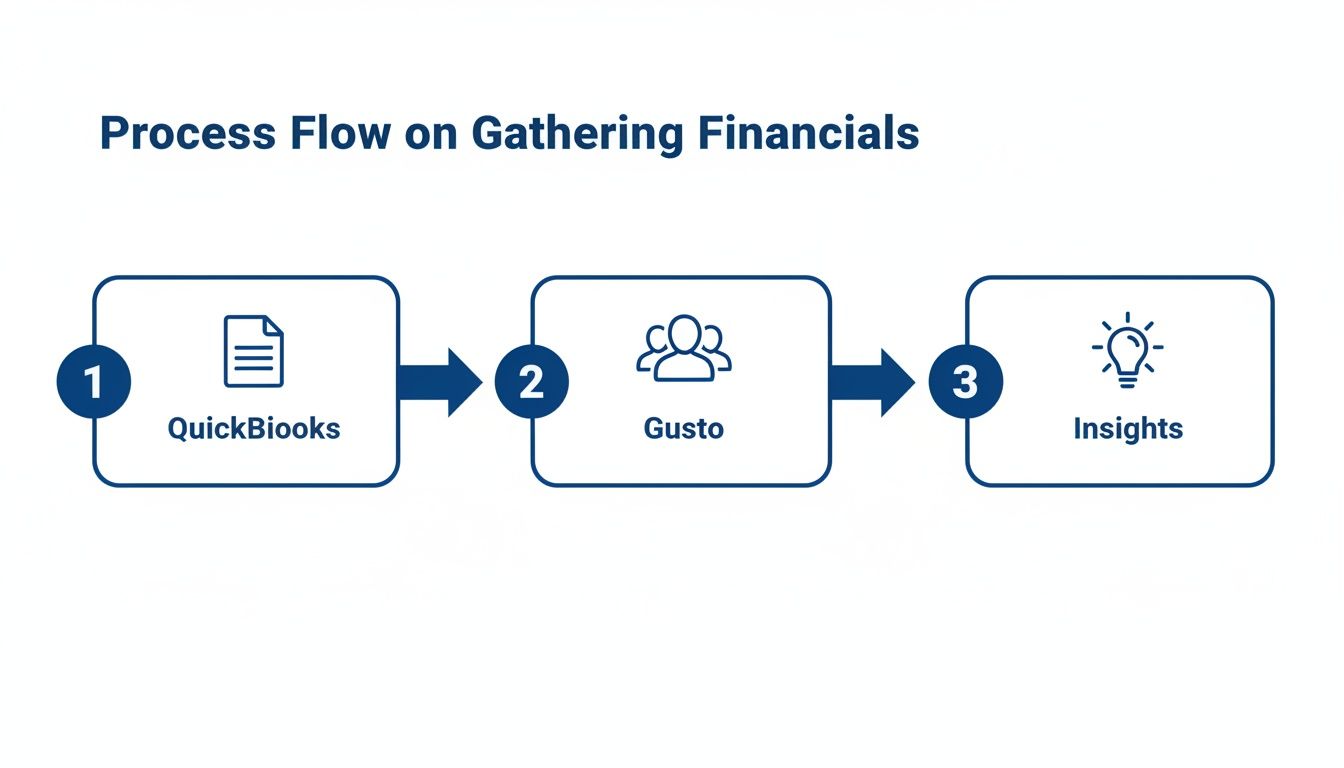
The image drives home a critical point: your forecast is only as reliable as the data you feed it. It all starts with accurate, well-organized numbers from your accounting and payroll platforms.
Projecting Your Revenue Realistically
For any service business, forecasting revenue is part art, part science. You can’t just tack on 10% to last year’s total and call it a day. A credible forecast has to be built from the ground up, starting with your sales pipeline and your existing client base.
First, list out all your current clients and their monthly recurring revenue (MRR) or expected project fees. Then, layer in your sales pipeline—but be brutally honest with yourself. One of the biggest mistakes I see is business owners treating every potential deal like it’s already in the bank.
A much better way is to use a probability-weighted approach. Think of it like this:
- Prospects (25% chance): These are leads you’ve had an initial chat with.
- Qualified Leads (50% chance): You’ve sent a proposal and confirmed they have the budget.
- Verbal Commitment (90% chance): They’ve agreed to the terms; you’re just waiting on the signed contract.
This simple method keeps your revenue forecast grounded in reality, not just optimism. To really get this right, it helps to understand how to create financial projections that tell a believable story with your numbers. This gives you a solid foundation for the rest of your model.
Calculating Your True Cost of Services
Next up is your Cost of Goods Sold (COGS), which for a service business, we usually call the Cost of Services. This isn’t just about salaries; it’s about every direct cost you incur to actually deliver your service to clients.
The key pieces to include are:
- Direct Labor: Salaries, payroll taxes, and benefits for your billable team members—the people doing the client-facing work.
- Essential Software: Subscriptions for tools that are absolutely necessary for service delivery, like your project management software or specialized design tools.
- Third-Party Contractors: Any freelancers or agencies you bring in to help with client projects.
By getting a clear picture of these costs, you can calculate your Gross Profit Margin, which is one of the most important KPIs you can track. It tells you exactly how much profit you’re making from your services before you even touch overhead expenses like rent or marketing.
Forecasting Your Operating Expenses
Operating Expenses (OpEx) are all the costs of keeping the lights on, whether you have one client or one hundred. The best place to start is by looking at your historical Profit & Loss reports from QuickBooks to create a baseline.
Split them into fixed and variable costs. Fixed costs are the predictable ones, like rent and insurance, that will likely be the same every single month. Variable costs, like your marketing budget or travel expenses, will probably fluctuate based on your strategic plans for the quarter.
Your past data is your guide, but your forecast has to reflect your future plans. If you’re planning to double your marketing spend in Q3 to launch a new service, you have to build that assumption right into your OpEx forecast.
This kind of detail is what separates a guess from a genuine financial plan. It’s also a critical piece of building a reliable cash flow projection, giving you a much clearer view of your net profitability and the levers you can pull to manage it.
Choosing Your Forecasting Method
Not every forecasting method works for every business. The right approach really depends on how long you’ve been around, how much data you have, and how stable your market is. A brand-new startup is going to use a different method than an established firm with years of clean data.
Here’s a quick rundown of some common approaches to help you pick the best fit.
Choosing Your Forecasting Method
| Forecasting Method | Best For | Data Required | Key Advantage |
|---|---|---|---|
| Straight-Line | New businesses or stable markets with predictable growth patterns. | Minimal historical data; often just the prior period’s results. | Simplicity. It’s easy to calculate and understand, providing a quick baseline. |
| Moving Average | Businesses with some seasonality or fluctuations to smooth out noise. | At least 3-6 months of consistent historical performance data. | Reduces the impact of one-off spikes or dips for a more stable trend line. |
| Driver-Based | Mature businesses that understand their key operational metrics. | Historical financials plus operational KPIs (e.g., sales calls, website traffic). | Highly accurate. It links financial outcomes directly to business activities. |
Ultimately, choosing a method is about finding the sweet spot between simplicity and accuracy for where your business is today. As you grow and gather more data, you can always evolve your approach to a more sophisticated model like driver-based forecasting.
How to Prepare for Financial What Ifs
A static annual budget is a good start, but let’s be honest—it’s just a snapshot in time. Business doesn’t stand still, and your financial plan shouldn’t either. To build a company that can handle the inevitable twists and turns, you need to go beyond a fixed plan and adopt a more dynamic approach to budgeting and forecasting.
This is where you start asking the really important “what if” questions. What happens to our cash flow if our biggest client suddenly leaves? Can we realistically afford to bring on those two new developers next quarter if a big deal falls through? Answering these questions before they happen is what gives your business financial agility.
Modeling Your Best, Worst, and Most Likely Scenarios
Scenario planning is a powerful way to prepare your business for a range of possible futures. Instead of creating just one forecast, you’ll build three. This isn’t about trying to predict the future; it’s about understanding the real-world impact of different outcomes on your bottom line.
Think of it as a financial fire drill. You’re building the muscle memory to react quickly and intelligently when the unexpected occurs. The goal here is to put numbers to the possibilities so you’re not making decisions based on gut feelings or fear.
Here’s a simple way to structure it:
- The Base Case (Most Likely): This is your main forecast, built on the realistic, probability-weighted assumptions we’ve already discussed. It’s the path you genuinely expect your business to take.
- The Upside Case (Best Case): What if that huge proposal you sent out closes a month early? Or a key client decides to double their retainer? Modeling this out shows you how much extra cash you might have, so you can plan how to reinvest it—maybe by paying down debt or accelerating a critical hire.
- The Downside Case (Worst Case): This is the most critical one. Model what happens if you lose your top client or a major project gets delayed by three months. This scenario immediately shines a spotlight on your financial weak points and tells you exactly how much cash runway you need to weather a storm.
By building these three scenarios, your forecast transforms from a simple prediction into a powerful strategic tool. You’ll know exactly which expense levers to pull or which investments to pause if your worst-case scenario starts becoming a reality.
Keeping Your Financial Vision Sharp with a Rolling Forecast
While scenario planning prepares you for major potential shifts, a rolling forecast keeps your financial view sharp and relevant every single month. A traditional annual budget gets less and less useful as the year goes on. A decision made in October is based on a plan that might be ten months out of date.
A rolling forecast fixes this problem. Instead of a fixed 12-month view from January to December, it’s a living 12-month outlook that you update monthly. When you close the books for January, you compare your actual results to the budget, figure out why there are differences, and then add a brand new forecast for the following January. Your financial window always looks a full year ahead.
This approach forces you to constantly look forward, adjusting your plans based on the latest, most accurate information. You can react to market changes, competitor moves, or your own team’s performance in weeks, not quarters.
This forward-looking mindset is vital, especially in an unpredictable economy. For example, recent US economic forecasts point to a period of adjustment. Deloitte projects that real GDP growth will cool to 2% in 2025, with unemployment potentially rising. You can dive into their full US economic forecast analysis to see how these trends could affect businesses like yours. A rolling forecast helps ensure you’re not caught off guard by these bigger economic shifts.
Combining scenario planning with a rolling forecast is a powerful one-two punch for financial management. You get high-level strategic awareness from your different scenarios and the practical, up-to-date clarity from your monthly updates. This comprehensive approach to budgeting and forecasting doesn’t just help you survive uncertainty—it empowers you to thrive in it by making confident, data-driven decisions no matter what comes your way.
Common Budgeting Mistakes and How to Avoid Them

Even with the best intentions, a budgeting and forecasting process can get knocked off course by a few common, easy-to-make mistakes. For service businesses, these missteps tend to show up in the same places, creating cash flow surprises and missed opportunities.
Knowing these pitfalls ahead of time is half the battle. Let’s walk through some of the most frequent traps we see business owners fall into and, more importantly, how to sidestep them.
Ignoring the Full Cost of Your Team
One of the most dangerous—and common—mistakes is underestimating what your team actually costs. It’s tempting to just plug an employee’s salary into your budget, but that number is far from the whole story. The “fully loaded” cost is always significantly higher.
You have to account for every single dollar tied to your people. This goes way beyond gross wages.
- Employer-side Payroll Taxes: This is your share of Social Security and Medicare (FICA), plus federal and state unemployment taxes (FUTA/SUTA).
- Benefits Contributions: What does the company pay toward health, dental, and vision insurance?
- Retirement Plan Matches: Don’t forget any matching contributions you make to employee 401(k) plans.
- Workers’ Compensation Insurance: This cost is directly linked to the size of your payroll.
Forgetting these items will blow a huge hole in your budget. A good rule of thumb is to add 18-25% on top of an employee’s gross salary to get a much more realistic number for their total cost.
Creating Sales Forecasts Based on Hope
Optimism is a great quality in an entrepreneur, but it can be a real liability when you’re forecasting revenue. A classic pitfall is treating every prospect in your pipeline as a done deal. This leads to wildly inflated revenue projections that the business can’t realistically hit, causing major cash flow problems down the line.
The fix? Ground your sales forecast in data, not just ambition.
A weighted pipeline is a simple but incredibly powerful tool to combat this. Instead of counting the full value of every potential deal, you assign a probability to each stage of your sales process. For example, a deal in the initial conversation stage might only have a 25% chance of closing, while one where you’ve sent a proposal is closer to 90%. This simple math creates a far more accurate and defensible revenue forecast.
A well-crafted budget is a strategic asset, not just a financial document. It guides your decisions and highlights potential issues before they become crises, ensuring your business stays on a path to sustainable growth.
Forgetting to Budget for Non-Billable Time
In a service business, not every hour your team works is an hour you can bill to a client. People need time for internal meetings, training, administrative work, and business development. Forgetting to account for this non-billable time is a recipe for burnout and bad capacity planning.
If your budget shows your team at 100% billable capacity, you’ve accidentally designed a system with no room for the very activities that keep the business running and growing. This oversight inevitably leads to project delays and a drop in service quality as everyone struggles to keep up.
The solution is to build a realistic utilization target right into your forecast. For most professional services firms, a target of 75-85% billable time is a healthy, sustainable benchmark. Budgeting for this buffer ensures you have the bandwidth for both client work and the internal investments your business needs to succeed.
For more guidance on building a solid plan from the ground up, our guide on creating a budget for small business offers a great starting point.
Your Questions on Budgeting and Forecasting Answered
Putting a financial plan into practice always brings up a few questions. This is completely normal. Think of this section as a quick reference guide to answer the most common things we hear from service business owners when they start digging into budgeting and forecasting.
How Often Should I Update My Business Forecast?
For most service-based companies, reviewing and updating your forecast monthly is the gold standard. This schedule lines up perfectly with your month-end close, meaning you’re always working with the freshest, most accurate data. A monthly check-in lets you compare your actual performance against the budget, a process we call variance analysis.
This regular rhythm is what keeps you agile. Did you just land a huge new client? Great, you can build that new revenue into your outlook right away instead of waiting a full quarter. This “rolling forecast” approach, where you consistently look 12 months ahead, keeps your plan from getting stale and helps you make much sharper decisions.
While a monthly update is ideal, a business in a very stable industry with predictable revenue might get by with a quarterly review. Honestly, though, in today’s economy, the monthly update gives you a real strategic advantage.
A forecast is a living document, not a historical artifact. The more frequently you update it with real-world data, the more valuable it becomes as a decision-making tool.
What Is the Difference Between a Budget and a Forecast?
It’s easy to mix these two up, but they have very different jobs. The simplest way to remember it is that a budget is your plan, and a forecast is your prediction.
A budget is a static financial roadmap, usually set once for the entire year. It’s where you set your targets and spending limits. For example, a budget might say, “We will generate $1 million in revenue and spend no more than $80,000 on marketing.” It’s the benchmark you measure everything against.
A forecast, on the other hand, is a dynamic look into the future. It’s your best guess of where you’ll actually end up, based on historical data, current trends, and any new information you have. It answers the question, “Given what we know today, where are we really headed?”
Let’s say six months into the year, you’ve landed more clients than you planned for and have already spent $60,000 on marketing. Your budget hasn’t changed, but your forecast would now project higher revenue and marketing spend for the full year. The budget provides discipline, while the forecast helps you adapt your strategy on the fly.
Which Software Is Best for Budgeting Besides Excel?
Spreadsheets like Excel and Google Sheets are fantastic starting points for budgeting and forecasting. But as a business grows, most owners eventually graduate to dedicated financial planning and analysis (FP&A) software.
Tools like Jirav, Fathom, and Reach Reporting are built specifically for this and offer some major advantages over spreadsheets.
- Automation: They plug right into platforms like QuickBooks Online, automatically pulling in your actual financial data. This slashes the time you spend on manual entry and cuts down on human error. In fact, one study found that 75% of an FP&A team’s time is spent just on data collection when using spreadsheets.
- Sophisticated Features: These tools come with pre-built dashboards, KPI trackers, and scenario planning modules that are much easier to manage than trying to build—and maintain—complex formulas in Excel.
- Collaboration: They create a single source of truth for your financials. Team members can access the plan with specific permissions, which improves transparency and gets everyone aligned.
For a new startup, a well-organized spreadsheet is perfectly fine. But as your financial model gets more complex, investing in a dedicated platform can save you dozens of hours a month and give you much deeper strategic insights. The right tool really just depends on your company’s size, complexity, and specific planning needs.
At Steingard Financial, we help service businesses move beyond spreadsheets to build robust financial systems that drive confident decision-making. If you’re ready for clear, accurate reporting and a dependable partner to manage your bookkeeping and payroll, let’s talk. Learn more about how we can give you back your time and peace of mind.