


A Practical Guide to the Cash Flow Formula for Business Health
At its most basic, the cash flow formula is simply Total Cash Inflows minus Total Cash Outflows over a set period. This quick calculation gives you a snapshot of how money is moving through your business, telling you whether you’ve gained or lost actual cash.
Why Cash Flow Is Your Business’s Most Honest Metric

Think of your business as a high-performance engine. Revenue and profit are your horsepower—they look great on paper and show what your business is capable of. But cash flow? That’s the oil. Without a steady supply of oil circulating through the system, even the most powerful engine will seize up, grind to a halt, and suffer catastrophic damage.
This isn’t just a clever analogy; it’s a core business truth. Profit doesn’t pay the bills—cash does.
It’s a scenario that has played out countless times: a profitable company suddenly goes under because it ran out of money. This happens when there’s a disconnect between the revenue you’ve earned and the actual cash sitting in your bank account. That invoice you sent to a client last month? It’s counted as revenue, but it isn’t cash until that payment actually lands. Getting this distinction right isn’t just a job for your bookkeeper; it’s a survival skill for every entrepreneur.
The Unfiltered Truth of Your Financial Health
The cash flow formula gives you an unfiltered, real-time look at your company’s financial stability. It cuts through the accounting complexities. Unlike profit, which can be influenced by non-cash items like depreciation or accruals, cash flow is brutally honest. It tracks the tangible money moving in and out of your business. When you master it, you’re empowered to make smarter, more confident decisions.
A firm grip on your cash flow allows you to:
- Fund Daily Operations: Have enough cash on hand to cover payroll, rent, and supplier payments without breaking a sweat.
- Manage Debt Responsibly: Make loan payments on time and manage your financial commitments with confidence.
- Invest in Future Growth: Know precisely when you can afford to purchase new equipment, bring on new team members, or expand your services.
- Prepare for Emergencies: Build a solid cash reserve to navigate unexpected downturns or jump on sudden opportunities.
Cash flow is the lifeblood of a business. It tells a story that the income statement can’t—the story of a company’s ability to survive and thrive day-to-day. A positive cash flow is the ultimate sign of operational efficiency and financial resilience.
At the end of the day, your income statement might tell you if you’re profitable, but your cash flow statement tells you if you can survive. By learning the key formulas for calculating it, you shift from simply running your business to strategically steering its financial future. This guide will walk you through the essential calculations you need to take control.
The Three Core Cash Flow Formulas Explained
While the simple idea of “cash in minus cash out” is a solid starting point, truly getting a grip on your business’s financial health requires a more nuanced approach. Different questions demand different ways of looking at your cash, which is why there isn’t just one single cash flow formula. Instead, three core formulas work together to paint the complete financial picture.
Think of them like different camera lenses. One gives you a tight close-up on your day-to-day efficiency, another provides a wide-angle view of your potential for future growth, and the third captures the entire scene, showing the net result of everything happening in your business. Learning to use all three is what separates good financial management from great strategic decision-making.
For a quick overview, here’s how these three essential formulas stack up.
The Three Essential Cash Flow Formulas at a Glance
| Formula | What It Measures | Key Components |
|---|---|---|
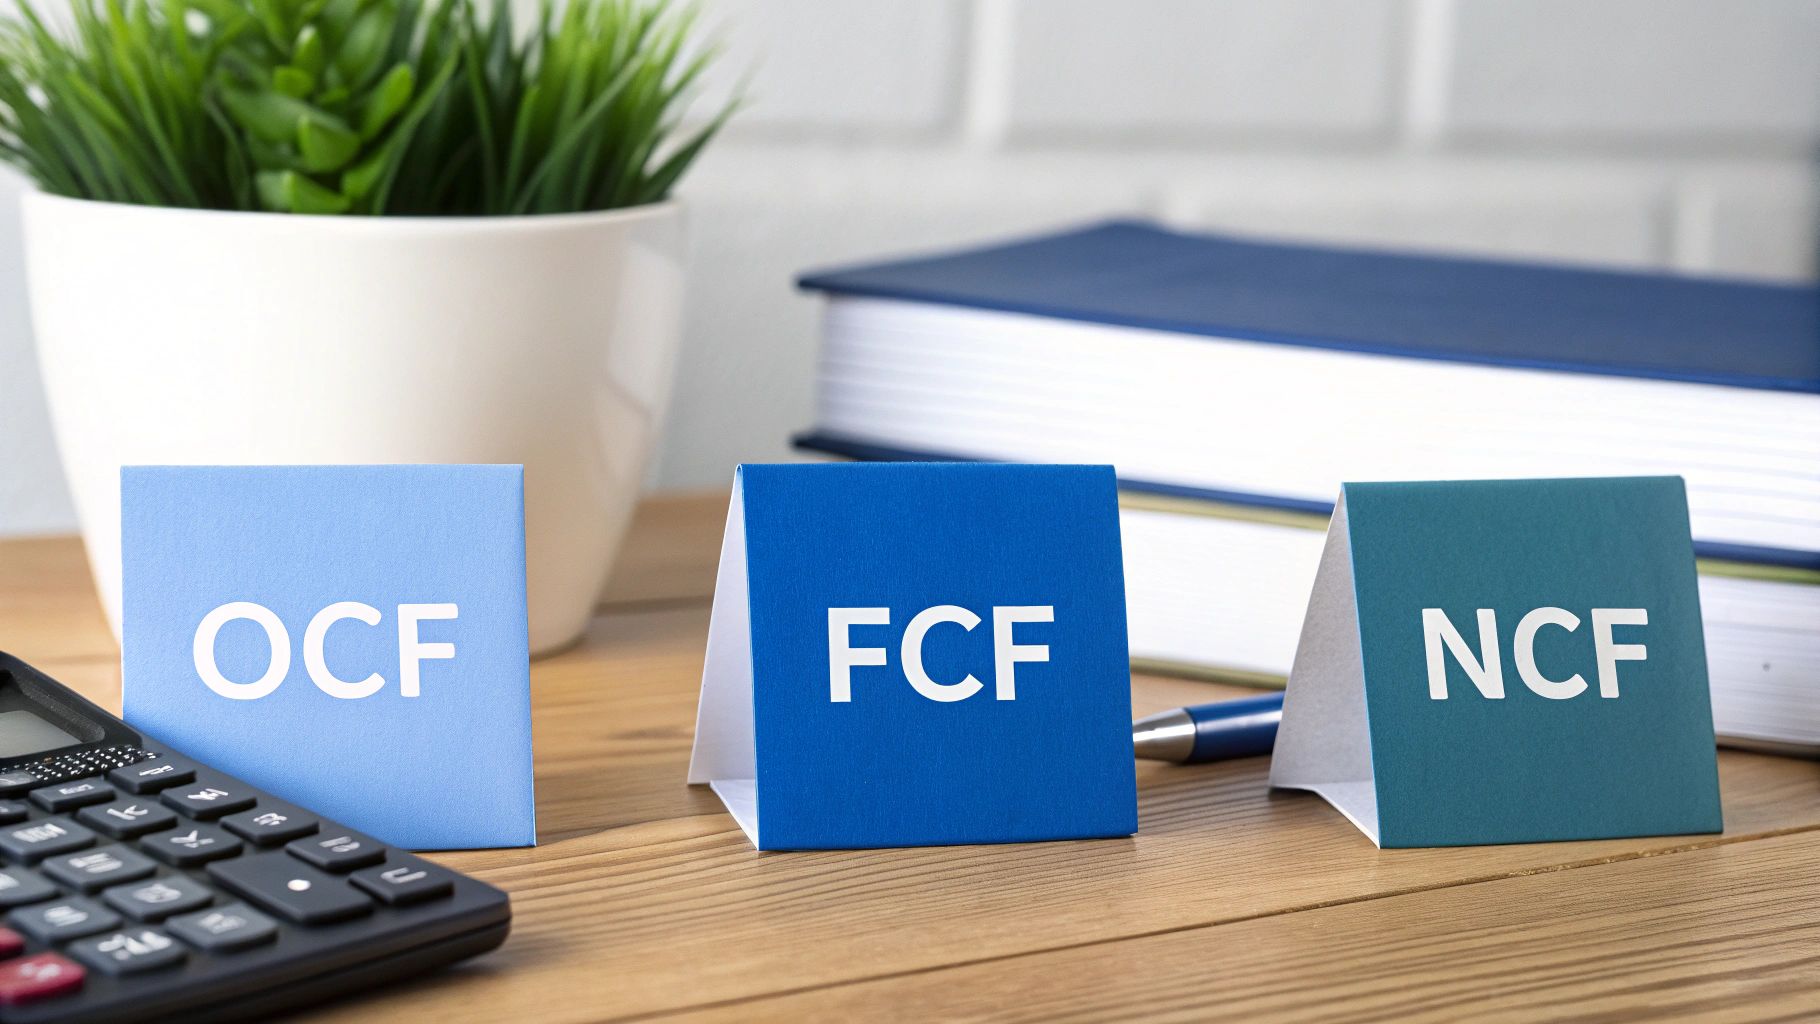
| Operating Cash Flow (OCF) | The cash generated from core business activities. | Net Income, Depreciation, Changes in Working Capital. |
| Free Cash Flow (FCF) | The cash available after paying for business operations and investments. | Operating Cash Flow minus Capital Expenditures (CapEx). |
| Net Cash Flow (NCF) | The total change in cash from all activities over a period. | Sum of cash from Operating, Investing, and Financing activities. |
Now, let’s dive into what each of these really tells you about your business.
Operating Cash Flow: The Engine Room
First, let’s talk about Operating Cash Flow (OCF). This is the cash generated directly from your company’s main business activities—the services you provide or the products you sell. It’s the purest signal of your operational health because it cuts out the noise from investing and financing activities.
A healthy, positive OCF means your core operations are self-sufficient. This is the money that keeps the lights on, pays your team, and covers your rent. It tells you whether the fundamental engine of your business is running smoothly and profitably.
Free Cash Flow: The Growth Fund
Next up is Free Cash Flow (FCF), a metric that savvy business owners and investors pay very close attention to. It takes your Operating Cash Flow and then subtracts any money you’ve spent on Capital Expenditures (CapEx). These are your big-ticket purchases meant to keep the business running or help it grow, like new equipment, company vehicles, or a major office upgrade.
The formula is straightforward:
- FCF = Operating Cash Flow – Capital Expenditures
Essentially, Free Cash Flow answers the critical question: “After running the business and reinvesting enough to maintain our assets, how much cash is actually left over?” This is the money you have available to pay down debt, distribute to owners as dividends, or—most excitingly—reinvest in new growth opportunities. It’s the ultimate measure of your company’s financial flexibility.
A business can have a positive operating cash flow but a negative free cash flow if it’s heavily investing in new equipment. This isn’t necessarily a bad sign—it often just signals a growth phase—but it’s a crucial distinction for financial planning.
Cash flow formulas are the bedrock of financial modeling and are essential for managing your liquidity. While a basic formula for net cash flow is Net Cash Flow = Total Cash Inflows − Total Cash Outflows, the real insights come from metrics like FCF. It’s calculated as Free Cash Flow = Operating Cash Flow − Capital Expenditures, giving you a clear view of the cash available to fuel operations and growth. You can learn more about how cash flow analysis drives smarter business decisions to see this in action.
Net Cash Flow: The Big Picture
Finally, there’s Net Cash Flow (NCF), which is sometimes called the Net Change in Cash. This is your comprehensive summary, the bottom line of your cash statement. It’s the sum of cash flows from all three categories of business activity:
- Operating Activities: Cash from your main business operations.
- Investing Activities: Cash used for or generated from investments (like buying or selling assets or property).
- Financing Activities: Cash from investors or lenders, or cash used to pay them back.
NCF reveals the total increase or decrease in your cash over a specific period. If your Net Cash Flow for the quarter is $10,000, it simply means your cash balance is $10,000 higher than when you started. It’s the final score that tells you whether your business as a whole generated or burned through cash.
Each of these formulas tells a unique and vital part of your financial story. By understanding how to calculate and interpret all three, you can move beyond just tracking numbers and start using them to confidently steer your business toward a successful future.
How to Calculate Operating Cash Flow Step by Step
Alright, let’s get practical. Knowing the theory is one thing, but the real power comes from actually calculating these numbers. We’ll kick things off with Operating Cash Flow (OCF), the metric that truly shows you how much cash your core business operations are generating.
For this walkthrough, we’re going to use the indirect method. It’s the most common approach for a reason—it neatly connects the profit you see on paper with the actual cash sitting in your bank.
Instead of tracking every single dollar that comes in and goes out, the indirect method starts with your Net Income—a number you can pull right from your Profit and Loss (P&L) statement. From there, we’ll make a few key adjustments to work backward and find your cash flow. Think of it like looking at the final score of a game and then rewinding the tape to see the key plays that led to that outcome.
Starting with Net Income
The first piece of the puzzle is your Net Income. This is your company’s profit after every single expense, including taxes, has been accounted for. It’s a fantastic measure of profitability, but it’s not a measure of cash.
Why the disconnect? Because your P&L often includes expenses that didn’t involve an actual cash payment (like depreciation) and recognizes revenue you haven’t collected yet. This is where the difference between accounting methods really matters. The P&L is almost always prepared using accrual accounting, which logs revenue when it’s earned and expenses when they’re incurred—not necessarily when the cash changes hands.
To get to the truth of your cash position, you have to bridge that gap. If you need a quick refresher, understanding the difference between cash basis and accrual basis accounting is a great place to start.
The basic OCF formula using the indirect method looks like this:
Operating Cash Flow = Net Income + Non-Cash Expenses +/- Changes in Working Capital
This might look a bit intimidating at first, but each part is just a logical step toward uncovering your real operational cash flow. Let’s break down the adjustments you need to make.
Adjusting for Non-Cash Expenses
Once you have your Net Income, the next move is to add back any non-cash expenses. These are expenses that reduced your profit on the P&L but didn’t actually require you to spend any cash during that period.
The classic example is Depreciation. When you buy a big-ticket item like a company vehicle or heavy equipment, you don’t write off its entire cost in the first year. Instead, you spread that cost out over its useful life through depreciation. Each year, that depreciation expense lowers your taxable income, but no cash actually leaves your bank account.
Since no money went out the door, we have to add this amount back to Net Income to get a clearer picture of our cash.
Factoring in Changes to Working Capital
The final step is to account for shifts in your Working Capital. This is simply the difference between your current operational assets and liabilities. For most service businesses, the two big players here are:
- Accounts Receivable (AR): This is the money your clients owe you for work you’ve already completed. If your AR goes up, it means you’ve recorded more revenue on paper than you’ve actually collected in cash. So, you need to subtract that increase from your Net Income.
- Accounts Payable (AP): This is the money you owe to suppliers and vendors. If your AP goes up, it means you’ve racked up expenses that you haven’t paid for yet, which means you’re effectively holding onto your cash longer. For that reason, you add this increase to your Net Income.
Think of it this way: if your clients are taking longer to pay you (increasing AR), your cash is tied up. If you’re taking longer to pay your bills (increasing AP), you’re preserving cash. These adjustments are what sync up your reported profit with the cash that actually moved.
A Practical OCF Calculation Example
Let’s put this all together. Imagine a small service firm, “Innovate Consulting,” has the following numbers for the last quarter:
- Net Income: $50,000
- Depreciation Expense: $5,000
- Increase in Accounts Receivable: $10,000
- Increase in Accounts Payable: $3,000
Now, we just plug these figures into our formula:
- Start with Net Income: $50,000
- Add back Depreciation: + $5,000
- Subtract the increase in AR: – $10,000
- Add the increase in AP: + $3,000
Calculation: $50,000 + $5,000 – $10,000 + $3,000 = $48,000
So, even though Innovate Consulting reported a profit of $50,000, its day-to-day operations only generated $48,000 in cold, hard cash. This is a critical insight. It tells us that while the company is profitable, a chunk of that profit is stuck in unpaid invoices. This is exactly the kind of actionable intelligence that a proper cash flow calculation gives you.
Mastering the Free Cash Flow Formula for Growth
If Operating Cash Flow (OCF) is the engine powering your business, then Free Cash Flow (FCF) is the fuel you have left for the journey ahead. It’s a powerful metric that shows you what’s really possible.
While OCF tells you if your core operations can pay the bills, FCF reveals your true strategic firepower. This is the number that investors, lenders, and savvy business owners look at to gauge how much cash is actually available for big moves.
Simply put, Free Cash Flow answers the crucial question: “After we’ve paid for everything to keep the lights on and reinvested in our core equipment and infrastructure, how much cash do we actually have left to play with?” This is the money you can use to pay down debt, distribute profits to owners, or fund exciting new projects without having to borrow.
Deconstructing the FCF Calculation
The beauty of the Free Cash Flow formula is its directness. If you’ve already figured out your Operating Cash Flow, you’re pretty much there.
The formula is straightforward:
Free Cash Flow (FCF) = Operating Cash Flow (OCF) – Capital Expenditures (CapEx)
We’ve already walked through how to calculate OCF. The only new piece of the puzzle here is Capital Expenditures, or CapEx. Don’t let the accounting jargon scare you; it’s a simple concept.
CapEx just represents the money your business spends to buy, upgrade, or maintain its physical assets—things like property, equipment, vehicles, or technology. Think of it as the necessary investment to keep your business running smoothly and efficiently. When a landscaping company buys a new commercial mower or a tech startup purchases new servers, both are examples of CapEx.
This diagram breaks down the calculation for Operating Cash Flow, which is your starting point for finding FCF.
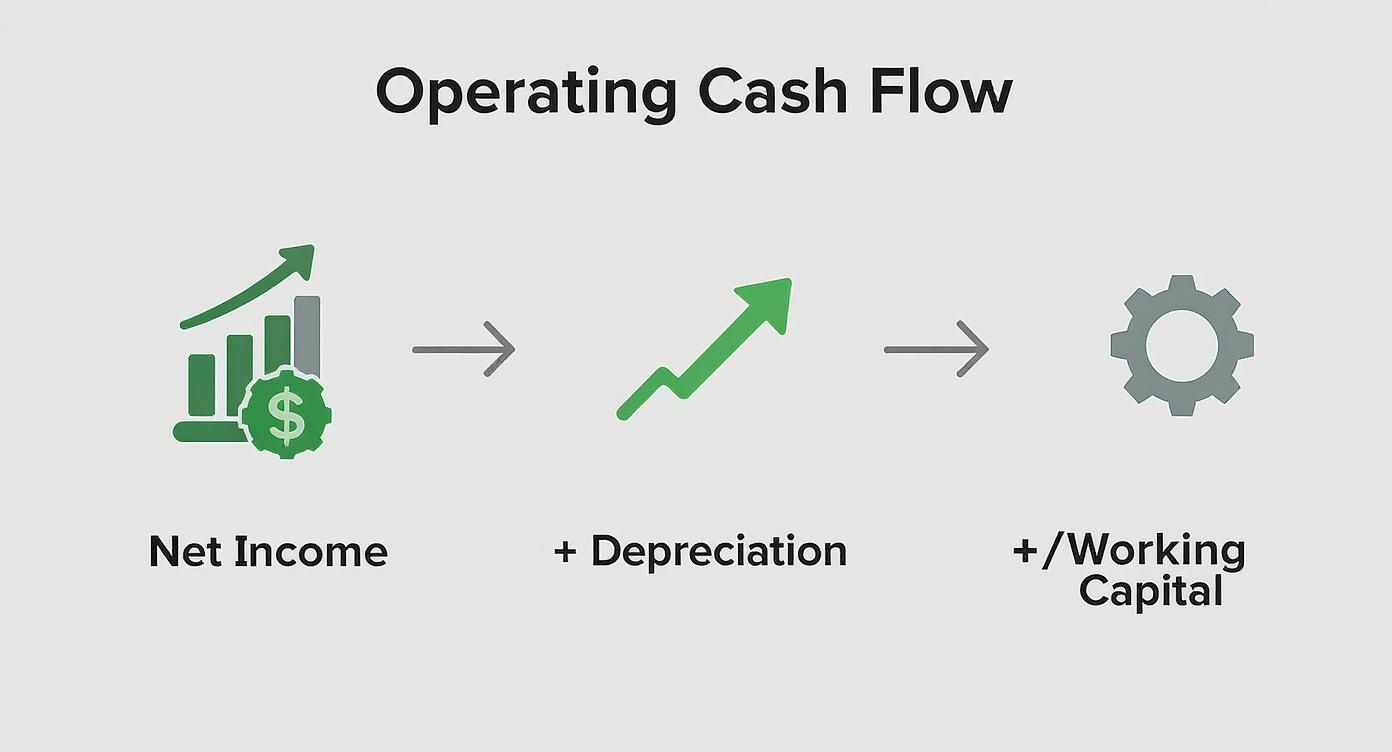
As you can see, getting to OCF involves adjusting your Net Income for all the non-cash stuff. Once you have that solid OCF number, you’re just one step away from calculating your Free Cash Flow.
FCF in Action: An Expansion Scenario
Let’s put this into a real-world context. Imagine a manufacturing business, “Precision Parts Inc.,” is thinking about expanding into a new facility. The owners need to know if they can afford the down payment using cash they’ve generated themselves.
Here’s a snapshot of their financials for the year:
- Operating Cash Flow (OCF): $500,000
- Capital Expenditures (CapEx): $150,000 (spent on new machinery for their current plant)
Using the Free Cash Flow formula, we get:
FCF = $500,000 (OCF) – $150,000 (CapEx) = $350,000
That $350,000 is the real cash surplus Precision Parts created. It’s the money they actually have available for strategic growth. With this number in hand, the leadership team can confidently decide how much to put toward the new building, how much to keep in reserves, and whether they can pay down some existing loans. Without FCF, they’d be looking at profit, which just doesn’t tell the whole story about available cash.
Why FCF Is a Superior Indicator of Health
Profit can be deceiving. A company can look incredibly profitable on its income statement but have very little cash in the bank. This can happen due to aggressive accounting methods or simply because the business requires constant, heavy investment in new equipment.
FCF cuts through the noise. It focuses on pure cash generation, which is much harder to manipulate.
- For Business Owners: It gives you a clear picture of your financial flexibility. Understanding your FCF is the foundation for building a reliable cash flow projection that lets you plan for the future with confidence.
- For Investors: It’s a direct signal of a company’s ability to create value. Businesses that consistently generate strong, positive FCF are typically seen as healthy, well-managed, and stable.
Tracking your Free Cash Flow helps you move from being reactive to proactive with your finances. It turns your financial reports from a history lesson into a strategic roadmap, empowering you to chart your company’s future with clarity.
Common Mistakes to Avoid in Your Cash Flow Analysis

Getting a handle on the cash flow formula is a great first step, but the real magic happens when you apply it correctly. A small error in your math can paint a dangerously misleading picture of your company’s health, pushing you toward bad decisions.
Think of it like being a pilot. You need to trust your instruments. If one of them is giving you faulty data, you could fly straight into a storm without even knowing it. To keep your analysis sharp and reliable, you need to steer clear of a few common traps.
Confusing Profit with Cash
This is, without a doubt, the biggest and most dangerous mistake a business owner can make. Your Profit and Loss statement might be glowing with a healthy net income, but that doesn’t mean the money is sitting in your bank account. Profit is an accounting idea; cash is what you use to pay the bills.
I’ve seen profitable companies on paper teeter on the edge of bankruptcy simply because they had no cash. This often happens when you make a big sale on credit. You record the revenue, which boosts your “profit,” but the cash might not actually show up for 30, 60, or even 90 days. Always remember: profit is theory, cash is fact.
Forgetting to Add Back Non-Cash Expenses
When you’re using the indirect method to figure out your operating cash flow, it’s critical to add back any non-cash charges. These are expenses that reduced your net income on paper but didn’t actually involve cash leaving your business. The most common one you’ll see is depreciation.
Depreciation is just an accounting tool for spreading the cost of a big purchase, like a vehicle or computer, over its useful life. It lowers your taxable income (which is good!), but no money actually goes out the door.
Forgetting to add depreciation back to your net income will make your operating cash flow look much lower than it really is. This mistake can make your business appear less efficient at generating cash, potentially causing you to shy away from smart growth opportunities.
Misinterpreting Working Capital Changes
The shifts in your working capital—especially what’s happening with your receivables and payables—tell a fascinating story about how quickly you turn your operations into cash. Getting this story wrong can hide some serious problems.
For instance, a big jump in accounts receivable might feel like a win because it points to strong sales. But what it really means is that your customers are taking longer to pay you, and your cash is tied up in those unpaid invoices. This is a red flag that needs your immediate attention. Tightening up your invoicing and collections is key, and it’s worth exploring accounts receivable best practices to get that cash in the door faster.
Here are a few signals from your working capital and what they’re trying to tell you:
- Rising Accounts Receivable: Your clients are paying you more slowly, putting a strain on your cash reserves.
- Rising Inventory: You have cash locked up in products sitting on a shelf instead of being sold.
- Rising Accounts Payable: You’re taking longer to pay your own bills. While this can temporarily help your cash balance, it can sour relationships with your suppliers if you’re not careful.
By sidestepping these common errors, you can be confident that your cash flow formula is giving you a true and actionable view of what’s really going on inside your business.
Answering Your Key Questions About Cash Flow
Getting a handle on the core cash flow formulas is a huge step. But like with anything, theory is one thing—putting it into practice for your own business is another. This is where the real-world questions pop up.
Think of this part as the practical Q&A session. We’re going to tackle some of the most common points of confusion and give you the confidence to start using these insights to make smarter business decisions.
What Is the Difference Between the Direct and Indirect Cash Flow Method
When it comes to putting together a cash flow statement, accountants have two ways to do it: the direct method and the indirect method. The real difference between them is how they figure out the cash flow from your day-to-day operations.
The direct method is simple and intuitive. It’s like reading your bank statement—it lists the actual cash you received from customers and the actual cash you paid out to employees, suppliers, and for other operating costs. It tracks every dollar as it comes in and goes out.
The indirect method, which you’ll see far more often, starts from a different place. It begins with the net income from your income statement and then works backward. It adds and subtracts things that affect profit but don’t involve cash, like depreciation, and accounts for changes in your working capital (like accounts receivable and inventory).
While the direct method shows where cash came from and where it went, the indirect method explains why your cash flow is different from your net income. This link between profit and cash is incredibly insightful, which is why most businesses stick with it.
At the end of the day, both methods will give you the exact same number for your net cash flow from operations. The indirect method is just the standard you’ll almost always run into.
Can a Profitable Company Have Negative Cash Flow
Yes, 100%—and it’s one of the most dangerous traps a business owner can fall into. It’s a classic, surprisingly common situation: the income statement is showing a nice profit, but the bank account is running on fumes.
This is exactly why you can’t just look at profit alone. This disconnect between profit and cash usually happens for a few reasons:
- Rapid Growth: If your business is taking off, you might be pouring cash into buying inventory to keep up with demand. That inventory is an asset, but it’s not cash until someone buys it.
- Slow-Paying Clients: A growing accounts receivable means you’ve made a lot of sales on paper, but you’re still waiting for the money to come in. You’re profitable, but you’re effectively acting as a free bank for your customers.
- Large Capital Investments: Maybe you spent a big chunk of cash on new equipment. That major expense drains your bank account today, but on your income statement, it’s spread out over years as depreciation.
- Debt Repayment: Paying down the principal on a loan is a huge cash-out activity, but it doesn’t show up as an operating expense on your income statement.
A profitable business running out of money is the textbook example of the old saying: “Revenue is vanity, profit is sanity, but cash is reality.”
How Often Should I Calculate My Business Cash Flow
The right answer really depends on the stage and health of your business. There’s no single rule that fits everyone, but you can use some common sense guidelines to find your rhythm.
Think of it like checking the gas gauge in your car. If you’re on a long road trip through the desert, you’re going to be watching it like a hawk. For your normal daily commute, a quick glance is probably enough. Your business cash flow is no different.
Here’s a simple way to look at it:
- Weekly Review: This is non-negotiable for startups, businesses with thin margins, or any company going through a cash crunch. A weekly check-in lets you spot trouble early and manage your bills and invoices with precision.
- Monthly Review: For most stable, established businesses, a detailed monthly review is the sweet spot. It helps you see trends, check your performance against your budget, and plan for the month ahead.
- Quarterly and Annual Review: These bigger-picture reviews are all about strategy. They help you understand seasonal patterns, see if major investments paid off, and build accurate financial forecasts for the future.
The key is to make it a habit. Regular monitoring transforms cash flow analysis from a stressful, reactive task into a powerful, proactive tool. You’ll catch small leaks before they become big floods.
How Does Historical Data Improve Cash Flow Forecasting
Your past financial data is the closest thing you have to a crystal ball. By looking at your past cash flow statements, you can uncover the unique financial rhythm of your business—and that rhythm is the foundation of any reliable forecast.
This isn’t just about looking backward for the sake of it. It’s about finding patterns that are very likely to repeat themselves. Research has even shown that using several years of past cash flow data makes forecasting models significantly more accurate.
By digging into your history, you can:
- Identify Seasonal Trends: Do you always see a cash dip in the summer and a spike before the holidays? Knowing this allows you to build up a cash cushion ahead of the slow months.
- Understand Payment Cycles: You can figure out how long it really takes customers to pay. If you know it’s typically 45 days, you can plan your own spending around that reality.
- Anticipate Expense Patterns: Big, recurring expenses like insurance premiums or annual software renewals won’t catch you by surprise if you know when they’re coming.
Without historical data, a cash flow forecast is just a guess. With it, your forecast becomes a data-driven roadmap that helps you turn potential cash crises into predictable, manageable parts of your business cycle.
At Steingard Financial, we believe that accurate, timely bookkeeping is the bedrock of reliable cash flow analysis. We provide the meticulous financial data you need to apply these formulas with confidence, turning numbers into a clear roadmap for growth. Let us handle the details, so you can focus on leading your business. Learn more about our bookkeeping and payroll services.