

How to Do a Balance Sheet A Guide for Service Businesses
To really nail down your balance sheet, you first need a solid grasp of its three main parts: assets (what your business owns), liabilities (what it owes), and equity (what’s left over for you).
These pieces are all connected by one foundational formula: Assets = Liabilities + Equity. This isn’t just a quirky accounting rule; it’s what ensures your financial snapshot is always complete and in balance.
Understanding Your Balance Sheet’s Core Components

Before diving in and building a balance sheet, let’s step back and understand what it truly represents. It’s far more than just a list of numbers—it’s a financial X-ray of your company’s health at a single point in time, revealing its structure and stability.
At its core, the balance sheet answers three simple but critical questions:
- What does my business own? (Assets)
- What does my business owe to others? (Liabilities)
- What is the business actually worth? (Equity)
The relationship between these parts is the bedrock of all accounting. If you want to dig deeper into the mechanics, check out our detailed guide on the basic accounting equation.
What Are Assets?
Think of assets as all the economic resources your service business owns that will provide some future benefit. They are the tools, cash, and claims you have that help you generate revenue. For service businesses, assets often look a bit different compared to a company selling physical goods.
For instance, a marketing agency’s most valuable current asset might be its accounts receivable—the money clients owe for campaigns you’ve already run.
Other common assets include:
- Cash: The money sitting in your business bank accounts.
- Prepaid Expenses: Think of your annual software subscription or insurance premium. You’ve paid for it, but haven’t used it all up yet.
- Fixed Assets: These are your long-term resources, like the computers your team uses, office furniture, or a company vehicle.
What Are Liabilities?
On the flip side, liabilities are your company’s financial obligations—the debts you owe to other people or businesses. They are claims against your assets, representing what you need to pay out. Getting a handle on your liabilities is absolutely crucial for managing cash flow and assessing financial risk.
A classic liability for a service-based company is deferred revenue (sometimes called unearned revenue). This happens when a client pays you upfront for a project you haven’t completed yet, like a retainer for a six-month consulting gig. That cash is a liability on your books until you deliver the service and actually earn it.
Other typical liabilities you’ll see are:
- Accounts Payable: The bills you owe to your suppliers, contractors, or vendors.
- Credit Card Debt: Any outstanding balances on your company credit cards.
- Business Loans: Money borrowed from a bank or other lender.
- Accrued Expenses: Expenses you’ve incurred but haven’t paid yet, like the payroll for the last week of the month.
What Is Equity?
Finally, there’s equity. Often called owner’s equity, this is the net worth of your company. It’s what’s left over after you subtract all your liabilities from your assets. Put another way, if you were to sell off everything your business owns and pay back every single debt, the cash remaining would be your equity.
Equity = Total Assets – Total Liabilities
This number is a huge indicator of your company’s financial standing. Positive and growing equity is a fantastic sign of a healthy, profitable business. It’s more than an internal benchmark; it’s a direct reflection of the value you’ve built over time through profits and smart investments.
To give you some context on why tracking this matters, global wealth-income ratios have climbed dramatically, from about 390% of world net domestic product in 1980 to a projected 625% in 2025. This shows a massive accumulation of assets relative to output, making precise balance sheet management more critical than ever.
Here’s a quick reference to keep these concepts straight.
The Balance Sheet Equation At a Glance
The table below breaks down the three core components of a balance sheet and gives a simple example for each that you’d likely see in a service business.
| Component | Definition | Service Business Example |
|---|---|---|
| Assets | Economic resources owned by the business that have future economic value. | Accounts Receivable (money owed by clients) |
| Liabilities | Financial obligations or debts owed to other parties. | Deferred Revenue (upfront payments for future work) |
| Equity | The residual value of assets after subtracting liabilities; the business’s net worth. | Retained Earnings (profits reinvested into the business) |
Understanding how these three elements interact is the first—and most important—step in mastering your business’s finances.
Gathering the Right Financial Information
An accurate balance sheet starts with accurate data. It’s as simple as that. Before you even open a spreadsheet or your accounting software, you need to pull together all the source documents that tell your company’s financial story. The old saying “garbage in, garbage out” is especially true when it comes to your books.
Think of yourself as a financial detective. Your first job is to gather all the clues—the raw data—that will eventually create a complete picture of your assets, liabilities, and equity. Rushing this step or working with incomplete information is the number one reason balance sheets don’t balance, and that leads to hours of frustrating rework.
Your Essential Document Checklist
First things first, get organized. Create a dedicated folder (digital or physical) for the specific reporting period you’re working on, whether it’s the end of the month, quarter, or year. The goal is to have every piece of evidence right at your fingertips.
Here’s a practical list of exactly what you need to pull together:
- Bank and Credit Card Statements: Grab the statements for all business-related accounts. These are your ground truth for confirming cash balances and any outstanding credit card debt.
- Loan Agreements: Any paperwork for business loans, lines of credit, or mortgages is critical. These documents spell out the principal balance (your liability) and interest terms.
- Accounts Receivable (A/R) Aging Report: For a service business, this is huge. This report lists all unpaid client invoices and tells you the exact value of your A/R asset.
- Accounts Payable (A/P) Aging Report: On the flip side, this report lists all the bills you owe to vendors, contractors, and suppliers. It defines your short-term liabilities.
- Payroll Records: Your summary reports from a service like Gusto or QuickBooks Payroll will detail any accrued wages you owe, payroll tax liabilities, and other related payables.
While you’re at it, make sure you have a solid system for tracking petty cash expenses. Those small, out-of-pocket transactions add up and can throw your final cash balance off if they’re not accounted for.
Why Each Document Matters
It’s not just about collecting a pile of papers; you have to understand what each one represents. That loan agreement isn’t just a formality—it translates directly into a long-term liability on your balance sheet. The grand total on your A/R aging report becomes the precise value of your Accounts Receivable asset. Each document is a puzzle piece that has a specific home.
An organized set of source documents is the difference between a balance sheet that takes 30 minutes to prepare and one that takes all weekend to troubleshoot. Your future self will thank you for being meticulous now.
The Role of Your Chart of Accounts
So you’ve got all your documents. Now what? This is where your Chart of Accounts (COA) comes in. Think of the COA as the filing system or index for your company’s books. It provides a specific “bucket” for every single transaction you make.
A well-structured COA is what allows your accounting software to magically pull the right numbers into the right sections of your balance sheet. It ensures that when you record a payment for office rent, it’s categorized correctly as an expense, while the purchase of a new company laptop is recorded as a Fixed Asset.
If your COA is a mess, your balance sheet will be, too. It’s the foundational structure that makes accurate reporting possible. If you need to get yours in order, check out our complete walkthrough on how to create a Chart of Accounts that actually works for your business.
Building Your Balance Sheet From Scratch
Alright, you’ve gathered all your source documents and have them neatly organized. Now it’s time to roll up our sleeves and put that data to work. We’re going to move from theory to a real-world application by building a balance sheet for a small marketing agency we’ll call “Creative Solutions Inc.”
This walkthrough will show you exactly how to translate those raw numbers from bank statements and reports into a polished, balanced financial statement. It’s a three-part process: list what you own (assets), detail what you owe (liabilities), and then calculate what’s left over (equity).
Phase One: Cataloging Your Assets
First things first, we need a complete list of everything the agency owns. It’s crucial to split this list into two groups: current assets (things that are cash or will likely turn into cash within a year) and non-current assets (your long-term stuff).
For Creative Solutions Inc., as of December 31st, their asset picture looks like this:
- Cash in Bank: A quick look at their bank statement shows $25,000 in the business checking account.
- Accounts Receivable: Their A/R aging report confirms that clients still owe them $15,000 for recently completed work.
- Prepaid Software Subscriptions: They paid $3,000 upfront for a yearly software license. Since they haven’t used it all up yet, it’s considered a prepaid asset.
These are the agency’s current assets—the lifeblood for day-to-day operations. Next, we’ll tack on the non-current (or long-term) assets.
- Office Equipment: The desks, chairs, and computers the team uses have a current book value of $12,000 after factoring in depreciation.
Adding all these up gives us the agency’s total assets. Pretty straightforward, right?
Phase Two: Detailing Your Liabilities
With the asset side done, we flip the coin and look at liabilities. Just like with assets, we’ll divide these into current liabilities (debts due within the next year) and long-term liabilities (debts with a due date further out).
Here’s the breakdown for Creative Solutions Inc.:
- Accounts Payable: Their records show they owe a freelance graphic designer $4,000 for a recent project.
- Credit Card Balance: The end-of-month statement shows an outstanding balance of $2,500.
- Accrued Payroll: For the last week of December, they owe $3,500 in wages to employees, which will be paid out in early January.
These are short-term obligations that require careful cash flow management. Now for the long-term debt.
- Business Bank Loan: They have a small business loan with $10,000 left on the principal.
Summing these up gives us the agency’s total liabilities. We’re almost there.
Phase Three: Calculating Equity and Assembling the Report
The final piece of the puzzle is owner’s equity. You won’t find this number on a specific report; you have to calculate it. Equity is simply what’s left for the owner after all liabilities are paid off—it’s the net worth of the business.
This diagram shows the general flow, from pulling raw data to organizing it into your financial statements.
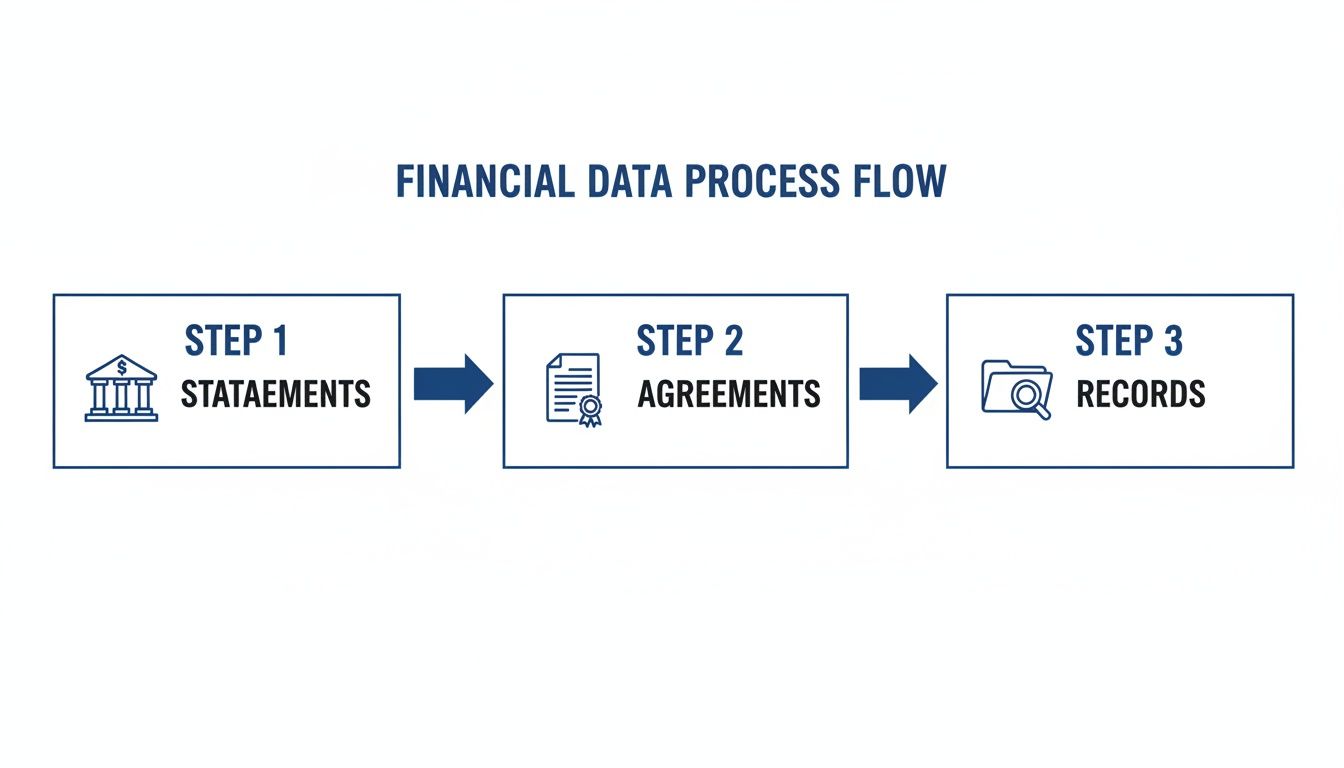
Following a clear process ensures every number on your final report can be traced back to a source document, which is the cornerstone of accurate bookkeeping.
For Creative Solutions Inc., their equity is made up of two key components:
- Common Stock: This represents the $20,000 the owner initially put in to get the agency off the ground.
- Retained Earnings: This is the cumulative profit the business has earned over time and reinvested back into operations.
Now, we can finally assemble all the pieces. If you’re looking for more hands-on examples, checking out a few personal balance sheet examples can be helpful for seeing how the different components fit together.
Here is what a simplified balance sheet would look like for Creative Solutions Inc. as of December 31, 202X. This clean, standard format clearly separates assets from liabilities and equity, making it easy to read at a glance.
The Final Balancing Act: This is the moment of truth. For Creative Solutions, their Total Assets come to $55,000. Their Total Liabilities ($20,000) plus Total Equity ($35,000) also equals $55,000. They match perfectly. This is how you know the accounting equation holds true and your numbers are correct.
This simple example shows you exactly how to transform raw financial data into a structured snapshot of your business’s health. If your numbers don’t balance, it’s a big red flag telling you to go back and double-check your work for an error—a critical step we’ll cover next.
How to Validate and Reconcile Your Numbers
You’ve carefully pulled together your assets, liabilities, and equity. Now for the moment of truth. A balance sheet that doesn’t balance isn’t just a minor hiccup; it’s a huge red flag that something in your numbers is off.
Think of this final step as quality control. It’s like proofreading a critical report before it goes to a client. You’re catching small mistakes before they balloon into big problems and ensuring the numbers on the page reflect what’s actually happening in your bank accounts.
The Art of Reconciliation
Reconciliation is just a fancy word for matching the numbers in your books to your source documents, like bank statements. It’s how you prove your balance sheet isn’t built on wishful thinking but on cold, hard facts.
For any service business, there are two reconciliations you absolutely can’t skip:
- Cash Account Reconciliation: The cash balance on your sheet must match your bank statements to the penny. This is the bedrock of trustworthy financials.
- Accounts Receivable Reconciliation: Your A/R total must tie out exactly to your A/R aging report, which is your master list of all unpaid client invoices.
This isn’t just busywork. It’s how you spot cash flow problems, catch unauthorized charges, or find simple data entry errors. For a deeper dive, our guide on how to reconcile bank accounts walks through the entire process.
Performing the Final Balancing Check
Once your key accounts are reconciled, it’s time for the final checkup. This is where you test the fundamental accounting equation for your own business. It’s a simple but incredibly powerful test.
Total Assets = Total Liabilities + Owner’s Equity
Add up everything on the asset side. Then, do the same for the liabilities and equity side. If those two totals match perfectly, you can breathe a sigh of relief. Your balance sheet is balanced, and you can trust the numbers.
But what if they don’t? Don’t panic. This is a common hurdle, especially when you’re just getting started. An imbalance is just a clue telling you it’s time to do a little detective work.
Troubleshooting an Unbalanced Sheet
When the numbers don’t add up, the problem almost always falls into one of a few common categories. The discrepancy isn’t random; it’s a trail of breadcrumbs leading you straight to the error. Start by checking these likely culprits.
Common Culprits and Quick Fixes
- Simple Data Entry Errors: A single misplaced decimal or transposed number is the classic offender. If your sheet is off by $450, check for a transaction that might have been entered as $45.00.
- Miscategorized Transactions: Did you buy a new company laptop (an asset) but record it as an office supply expense? That will understate your assets and throw everything off.
- Owner’s Draws Recorded as an Expense: Taking money out of the business for personal use is an owner’s draw, which reduces your equity. It’s not a business expense. Misclassifying this directly impacts the right side of the equation.
- Forgetting Accrued Expenses: Did you forget to account for payroll your team earned this month but won’t be paid until next month? That’s an accrued liability that has to be on the balance sheet.
- Outdated Loan Balances: Your loan balance goes down with every principal payment you make. Make sure the liability on your report reflects the current principal owed, not the original loan amount.
Working through this list systematically is the fastest way to find the source of the problem. By taking the time to validate and reconcile, you turn your balance sheet from a piece of paper into a reliable tool for managing your business.
Translating Your Balance Sheet Into Business Insights
Getting a perfectly balanced report is a huge win, but it’s not the end of the road. The real magic happens when you start using that balance sheet to make smarter business decisions. This is the moment you shift from being a scorekeeper to a strategist, turning what looks like a static list of numbers into a powerful game plan.
By calculating just a few key financial ratios, you can get a solid check-up on your company’s health, spot little problems before they become big ones, and uncover hidden opportunities for growth. Your balance sheet goes from being a document you have to create to a tool you get to use to steer your business forward.
Assessing Short-Term Health with the Current Ratio
The current ratio is one of the first metrics any service business owner should look at. Think of it as a quick stress test for your company’s ability to handle its short-term bills. It answers a simple but critical question: “Do I have enough cash on hand (or assets that will turn into cash soon) to pay my bills over the next year?”
The formula is pretty straightforward:
Current Ratio = Current Assets / Current Liabilities
A ratio of 2:1 is often seen as the gold standard, meaning you have $2 in current assets for every $1 you owe in the short term. For service-based businesses that don’t carry inventory, a healthy range is typically between 1.5 and 2.5. This tells you there’s a comfortable buffer.
Here’s how to read the signs:
- A Declining Ratio: If you see your current ratio dipping month after month, it’s a warning light. Is it because clients are taking longer to pay their invoices, causing your accounts receivable to balloon? That insight might push you to tighten up your collections process or maybe offer a small discount for early payments.
- A Very High Ratio: You might think a super high ratio is great, but anything over 3.0 isn’t always good news. It could mean you have too much cash just sitting in a bank account, earning next to nothing. That money could be put to work by investing in marketing, hiring a key team member, or upgrading your tech to fuel more growth.
Measuring Financial Risk with the Debt-to-Equity Ratio
While the current ratio gives you a snapshot of today, the debt-to-equity ratio zooms out to show you the long-term picture of risk. It reveals how much of your business is financed by borrowing versus how much is funded by your own investment (or retained earnings).
The calculation looks like this:
Debt-to-Equity Ratio = Total Liabilities / Total Equity
Generally, a lower number here is better because it means you’re relying less on debt. For a service business, a ratio below 1.0 is fantastic. A number between 1.0 and 1.5 is usually considered perfectly fine. But if that ratio starts climbing toward 2.0 or higher, it can be a red flag for lenders and investors, signaling that the business might be carrying too much risk.
Knowing this number helps you make strategic decisions about funding. For instance, if your ratio is incredibly low, say 0.2, you likely have the financial strength to take on a loan for a strategic expansion without putting the company in a precarious position.
Understanding Operational Efficiency with Working Capital
Working capital isn’t a ratio, but a hard dollar amount that shows your company’s day-to-day financial firepower. It’s the cash you have available to run the business—to make payroll, pay suppliers, and cover unexpected costs.
The formula is as simple as it gets:
Working Capital = Current Assets – Current Liabilities
A positive number is what you’re aiming for. It means you have more than enough short-term assets to cover your short-term liabilities. If that number slips into the negative, it’s a serious warning sign that you could struggle to pay your bills on time.
Watching the trend in your working capital is just as important as the number itself. If you see it shrinking every month, it’s time to play detective. Are your bills (payables) growing faster than your collections (receivables)? Are you burning through cash too quickly? This one number can tell you exactly where to start digging.
Ultimately, these metrics are vital for demonstrating financial discipline. The global wealth landscape shows that net financial wealth hit a high of $305 trillion in 2024, with investors increasingly focused on organic growth and consistent asset accumulation. This data highlights that for growing companies, a well-managed balance sheet is a critical competitive advantage when attracting capital. Discover more insights about these global wealth findings on bcg.com.
Answering Your Balance Sheet Questions
Even with a step-by-step guide, real-world business scenarios rarely fit into neat little boxes. Once you start digging into your own numbers, practical questions are bound to pop up. This section is designed to tackle those common “what if” and “why” questions head-on.
We’ve gathered the most frequent questions we hear from business owners and provided straightforward, expert answers to help you move forward with clarity.
How Often Should I Prepare a Balance Sheet?
For making smart internal decisions, you really need to be looking at your balance sheet at least monthly. This rhythm gives you a timely view of your financial position, helping you spot trends, manage your cash, and catch small issues before they snowball.
A monthly review also makes it much easier to find and fix mistakes early. For outside needs, like a bank loan application or investor updates, you’ll typically be asked for quarterly and annual reports. The key is to get into a consistent habit so you always have a current, accurate picture of your company’s financial health.
What Is the Difference Between a Balance Sheet and an Income Statement?
This is a classic, and the easiest way to think about it is with a simple analogy: a balance sheet is a snapshot, while an income statement is a movie.
-
The Balance Sheet (Snapshot): This report shows what your company owns (assets) and what it owes (liabilities) on a single day—for example, as of December 31st. It’s a static picture of your financial position at one specific moment in time.
-
The Income Statement (Movie): This is your Profit & Loss (P&L) statement. It shows your performance—revenues, expenses, and profit—over a period of time, like a month, quarter, or year. It tells the story of how your business operated during that period.
These two reports are deeply connected. The net income (or loss) from your P&L “movie” flows directly into the owner’s equity section of your balance sheet “snapshot,” usually into an account called Retained Earnings. They tell different but equally vital parts of your financial story.
Can I Create a Balance Sheet Myself or Do I Need an Accountant?
Modern accounting software like QuickBooks makes it mechanically possible to generate a balance sheet with just a few clicks. But a report is only as good as the data you put into it. Doing it right requires a real understanding of core accounting principles.
Simple mistakes, like misclassifying a transaction or forgetting to reconcile an account, can create a completely misleading report. Making big strategic decisions based on flawed numbers can be incredibly costly. For a very simple business with just a handful of transactions, a DIY approach might work for a little while.
As your service business grows, however, so does the complexity. Partnering with a professional ensures your numbers are not just generated, but are accurate, compliant, and insightful. This gives you the confidence to focus on running your business, not second-guessing your financials.
Why Doesn’t My Bank Account Balance Match the Cash on My Balance Sheet?
This is probably one of the most common points of confusion for business owners. The reason these two numbers rarely match perfectly is all about timing. Your balance sheet shows your “book balance” (your internal record), while your bank statement shows your “bank balance.”
Several things can cause this difference:
- Outstanding Checks: You’ve written and recorded checks in your accounting software, but the people you paid haven’t cashed them yet. Your books show the cash is gone, but the bank doesn’t know it yet.
- Deposits in Transit: You recorded a client payment in your books on the last day of the month, but it hasn’t fully cleared the bank and appeared on your statement.
The process of bank reconciliation is designed to identify and account for these exact timing differences. By matching your internal records to the bank’s, you confirm every transaction is accounted for and that the “Cash” figure on your balance sheet is accurate and reliable.
Feeling overwhelmed trying to make sense of your financials? The team at Steingard Financial specializes in taking the complexity out of bookkeeping and payroll for service businesses like yours. We provide accurate, timely financial statements and the expert guidance you need to make confident decisions and drive growth. Stop wrestling with spreadsheets and get the clarity you deserve. Visit us online to learn how we can help.