

How to Read a Balance Sheet: A Simple Guide to Smart Decisions
To really understand your balance sheet, you just need to compare what your business owns (Assets) against what it owes (Liabilities) and what’s left in your pocket (Equity). It all comes down to one simple, but incredibly powerful, formula: Assets = Liabilities + Equity. Getting comfortable with this equation is the first step to seeing the full financial story of your service business.
Your Business Health on a Single Page

You can forget the dense accounting textbooks for now. The balance sheet isn’t just some stuffy document for your CPA; it’s a practical tool that gives you a clean snapshot of your company’s financial position at a specific moment. Think of it like a financial photograph—it freezes everything in place so you can see exactly where you stand.
Knowing how to read it is crucial for making smarter, more confident decisions. It’s your roadmap for managing cash, planning your next big move, and building a more resilient business. This one page can reveal hidden risks and opportunities you’d otherwise miss completely.
Why This Matters for Your Service Business
For a service-based business—like a marketing agency, a software consultancy, or an HR firm—the balance sheet tells a particularly interesting story. Unlike a retailer with a warehouse full of products, your most valuable assets might be things like cash in the bank, outstanding client invoices (your Accounts Receivable), and maybe even the intellectual property you’ve built.
Let’s take a growing marketing agency as an example. On the surface, they’re crushing it with a flood of new clients. But a quick peek at their balance sheet reveals a brewing storm:
- High Accounts Receivable: A lot of money is owed to them, which looks great, but none of it is in their bank account yet.
- Low Cash: Their actual cash on hand is getting dangerously low.
- Rising Accounts Payable: At the same time, their own bills to vendors and contractors are starting to pile up.
This agency is “asset rich but cash poor”—a surprisingly common and risky spot to be in. Without looking at the balance sheet, the owner might keep spending, thinking the business is flush with cash, when it’s actually barreling toward a cash flow crisis. Learning to spot these patterns is everything. To get a feel for what this looks like in practice, it helps to review a practical sample balance sheet for small businesses.
A balance sheet isn’t about judging past performance; it’s about gaining the clarity needed to shape your future. It answers critical questions like, “Can we afford to hire?” or “Do we have enough of a cushion to weather a slow month?”
The Core Components Explained
At its heart, the balance sheet is built on three core pillars. Get a handle on these, and the rest falls into place.
| Component | What It Represents | Key Question It Answers for You |
|---|---|---|
| Assets | Everything your business owns that has value. | “What resources do I have to work with?” |
| Liabilities | Everything your business owes to others. | “Who do I owe money to, and how much?” |
| Equity | The net worth of your business after all debts are paid. | “What is my business actually worth?” |
Once you understand these three concepts, you’re moving from just running your business to truly understanding its financial engine. Of course, this all relies on accurate numbers. Sticking to solid financial reporting best practices ensures the data you’re analyzing is trustworthy and ready to guide your decisions.
A Practical Guide to Your Business Assets

The first stop on our tour of the balance sheet is the Assets section. Think of assets as everything your business owns that holds some kind of monetary value. These are the resources you have on hand to run the company and, hopefully, help it grow.
When you pull up your balance sheet, you’ll notice that assets are always organized in a specific way: from most liquid to least liquid. This isn’t just for neatness; it’s designed to give you a quick read on your financial flexibility. It starts with cash (or things that can become cash quickly) and moves down to the long-term stuff you use to operate the business. Grasping this structure is the first step to pulling real meaning from the numbers.
Breaking Down Current Assets
Current assets are your short-term resources. We’re talking about anything you expect to use, sell, or turn into cash within the next year. For a service business, this list is your lifeline, as it directly reflects your ability to cover immediate costs like payroll and rent.
Your QuickBooks report will typically list these in a specific order:
- Cash and Cash Equivalents: This one is as straightforward as it gets. It’s the actual money sitting in your business checking and savings accounts.
- Accounts Receivable (AR): This is all the money your clients owe you for services you’ve already provided but haven’t been paid for yet. For service firms, this number is often one of the biggest and most important current assets on the books.
- Prepaid Expenses: Think of things like your annual insurance premium that you paid upfront. It’s considered an asset because you’ve paid for a service you’ll benefit from over the next 12 months.
A healthy balance here is absolutely critical. Having too little cash can obviously spell trouble, but a massive Accounts Receivable balance can also be a red flag if clients aren’t paying you on time.
The Nuances of Accounts Receivable
Let’s zoom in on Accounts Receivable for a moment, because for any service-based business, this line item tells a powerful story. It isn’t just a number; it’s a direct measure of how effective your invoicing and collections processes really are. A high AR figure might look impressive—it means you’re billing for a lot of great work!
But it can also signal a brewing cash flow problem. If that number keeps creeping up month after month, it could mean your clients are dragging their feet, or your collections process is broken. It’s crucial that your bookkeeping is precise here; the number should reflect what you realistically expect to collect, not just the total of every invoice you’ve ever sent out.
The real value of your Accounts Receivable isn’t what you’ve billed—it’s what you can actually collect. Regularly aging your AR report is non-negotiable to spot invoices lingering past 30, 60, or 90 days.
This is where looking at your historical data becomes incredibly valuable. The bigger economic picture can also sharpen your analysis. For instance, the global balance sheet quadrupled from 2000 to 2021, growing much faster than GDP. This highlights how financial assets on paper can sometimes detach from the real economy. For your business, it just underscores the importance of making sure your current assets can truly cover your short-term debts, ideally with a current ratio above 1.5.
Understanding Non-Current Assets
Next up are non-current assets, which you might also hear called long-term assets. These are the resources you own that you don’t expect to convert into cash within the next year. They represent the foundational investments you’ve made to run your business for the long haul.
For a typical service business, this list is often shorter but just as important:
- Property, Plant, and Equipment (PP&E): This bucket holds tangible items like company laptops, office furniture, or vehicles. Their value is shown net of depreciation—the accounting method of spreading an asset’s cost over its useful life.
- Intangible Assets: This category can include things like patents, trademarks, or the capitalized cost of developing your own software. For a tech consultancy, for example, its intellectual property could easily be its most valuable non-current asset.
Tracking these long-term investments is key to understanding your company’s capital structure. Proper accounting for these items, including depreciation, is essential for an accurate picture of your business’s true value. For a deeper dive, check out our guide on how to calculate capital spending, which is directly tied to managing these long-term assets.
Decoding What Your Business Owes and Owns
We’ve covered what your business owns—the assets. Now, let’s flip the coin and look at the other side of the balance sheet: liabilities (what you owe) and owner’s equity (what you own free and clear).
Getting a handle on this half is absolutely critical for managing your cash flow, understanding your financial risk, and seeing the real net worth you’ve built.
Much like your assets, your liabilities are organized in a specific way. The structure is designed to separate your immediate bills from your long-term debts, helping you prioritize payments and keep your day-to-day operations running smoothly.
Understanding Your Business Liabilities
Simply put, liabilities are any debts or financial obligations your business owes to someone else. They are the claims against your company’s assets. Think of this section as a to-do list of everything you eventually have to pay back.
For a service-based business, this list often includes things like invoices from vendors, outstanding credit card balances, or payroll your team has earned but hasn’t been paid out yet. Keeping a close eye on this is non-negotiable for staying financially healthy.
Current Liabilities: What You Owe Soon
Current liabilities are your short-term debts—specifically, anything due within the next 12 months. These are the operational debts that pop up day-to-day and demand constant attention to prevent cash flow headaches.
Here’s what you’ll typically find:
- Accounts Payable (AP): This is the money you owe your vendors and suppliers. For instance, if you bring on a freelance copywriter for a project and they send you an invoice, that dollar amount lives in your AP until you pay them.
- Accrued Expenses: These are costs you’ve incurred but haven’t received a formal bill for just yet. The most common example is employee payroll—your team has done the work and earned their wages, but payday might be a week or two away.
- Credit Card Balances: Any unpaid balance on your business credit cards falls squarely into this category.
- Short-Term Loans: This includes the portion of any business loan that’s scheduled to be paid off within the next year.
Managing these liabilities is a tightrope walk. Strong bookkeeping, like we cover in our guide to accounts payable best practices, is key to making sure bills get paid on time without suddenly draining your bank account.
The screenshot from QuickBooks Online below shows how cleanly this information is laid out, giving you a quick snapshot of your short-term financial duties.
This report clearly separates Accounts Payable from Credit Cards, making it easy to see exactly where your short-term cash is going.
Non-Current Liabilities: Long-Term Obligations
Further down the list, you’ll see non-current liabilities. These are the long-haul financial commitments that aren’t due within the next 12 months.
For most service businesses, the big one here is usually a long-term business loan. This could be an SBA loan you took out to get started or a traditional bank loan you used to fund a major expansion. Separating these from current liabilities is important because they don’t represent an immediate drain on your cash.
Understanding the mix between your short-term and long-term debt is a core part of reading a balance sheet. It parallels global economic trends, where the balance between different types of debt dictates solvency. Global debt, a key balance sheet component, outpaced GDP growth by a factor of four between 2000 and 2021. This highlights how crucial it is for businesses to reconcile bank statements weekly to track liabilities and avoid risks. Discover more insights about corporate balance sheets.
Unpacking Owner’s Equity: Your Business Net Worth
Finally, we get to Owner’s Equity. This is the good stuff. After you subtract all your liabilities from your assets, what’s left is your equity. It represents the portion of the company that you, the owner, truly own—it’s the net worth of your business.
This section usually breaks down into a couple of key parts:
- Contributed Capital: This is the money or assets you (and any other owners) initially put into the business to get it off the ground.
- Retained Earnings: This is the running total of all the profit your business has ever made that hasn’t been paid out to the owners. Instead of taking it as a draw or dividend, that money was “retained” and put back into the company to fund growth.
As a service business owner, watching your retained earnings grow is one of the clearest signs you’re building something that lasts. It means your business isn’t just surviving month-to-month—it’s thriving and creating real, tangible wealth.
Calculating Ratios That Actually Matter
Once you have your balance sheet neatly laid out, the real fun begins. Those numbers aren’t just for show; they’re puzzle pieces that, when put together, tell the story of your business’s financial health. This is where a few simple calculations, known as financial ratios, come into play. You don’t need a finance degree—just a calculator and the balance sheet you’ve already put together.
For a service business, we can cut through the noise of complex manufacturing metrics. Instead, we’ll focus on a handful of ratios that get straight to the point: measuring your stability and risk. These calculations will tell you if you have enough cash to cover your bills, how much debt is fueling your operations, and your overall efficiency.
The Current Ratio: A Quick Liquidity Check
First on the list is the current ratio. Think of it as a quick stress test for your short-term finances. It answers one critical question: “If all my short-term bills came due tomorrow, could I pay them off with the assets I can quickly turn into cash?”
For any service-based business where client payments can be unpredictable, this is a metric you absolutely have to watch.
The formula couldn’t be simpler:
Current Ratio = Current Assets / Current Liabilities
A ratio of 1.0 means you have exactly one dollar in liquid assets for every dollar you owe in the near future. While that might sound perfectly balanced, it’s cutting things way too close for comfort. You need some breathing room.
- What this tells me: It’s your immediate cash-on-hand gauge. A low number is a warning sign that you might struggle to make payroll or pay your vendors if a big client payment is late.
- What to aim for: A healthy target for most service businesses is a current ratio between 1.5 and 2.0. This shows you have a solid cushion to handle unexpected costs without breaking a sweat.
Debt-to-Equity Ratio: Your Risk Assessment
Next up is the debt-to-equity ratio. This one peels back the curtain on how your business is funded. Is it running on your own money (equity) or is it propped up by loans and credit (debt)? This is a direct measure of your financial risk.
Here’s how you calculate it:
Debt-to-Equity Ratio = Total Liabilities / Total Equity
A high ratio means your business is leaning heavily on creditors to finance its assets. While a little bit of debt can be a smart way to fuel growth, too much puts you in a risky spot, especially if the economy takes a downturn.
The chart below gives you a clear visual of this concept—the balance between what you owe and what you truly own.
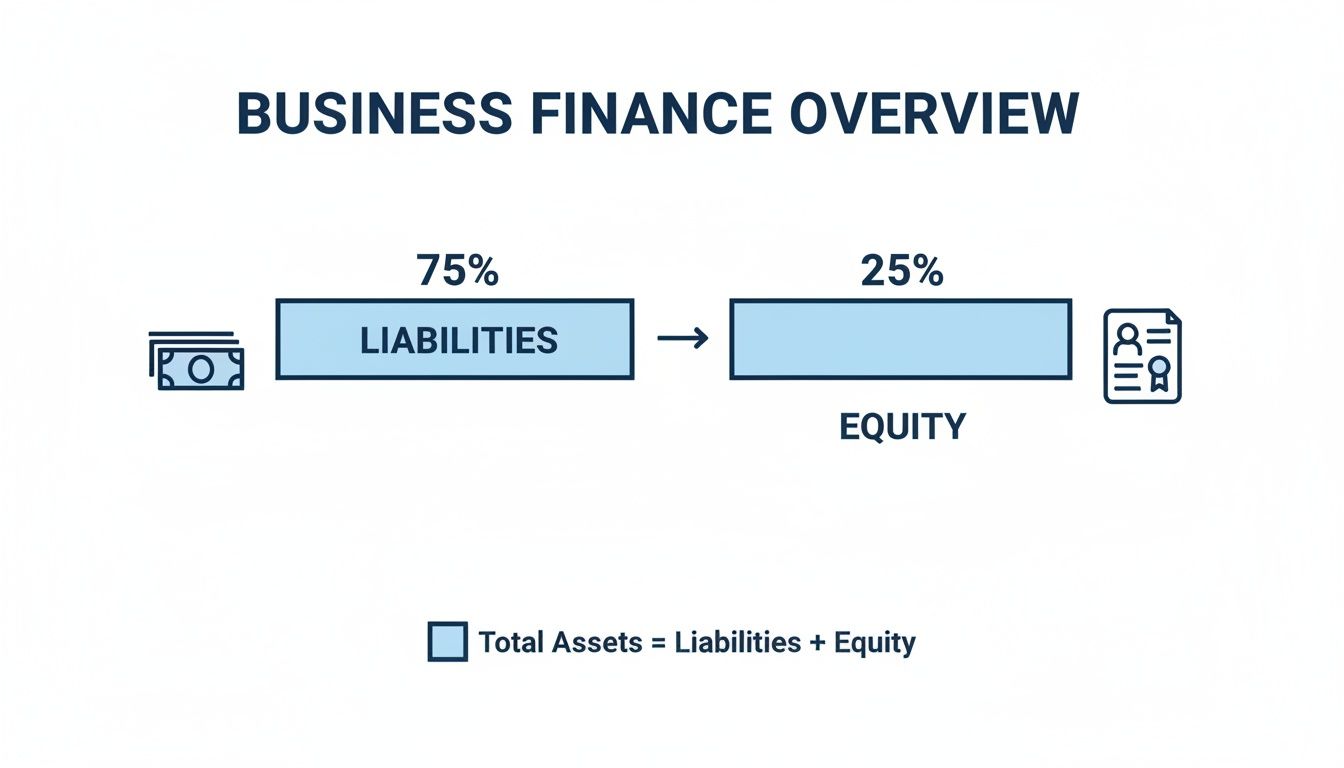
As you can see, the bigger that equity slice is, the stronger and more stable your company’s financial foundation.
Working Capital: Your Operational Runway
Finally, let’s talk about working capital. While it’s a dollar amount and not technically a ratio, it goes hand-in-hand with the current ratio. It tells you exactly how much cash is left over to run the day-to-day operations after all your short-term debts are covered.
The math is easy:
Working Capital = Current Assets – Current Liabilities
A positive number is what you’re looking for. It means you have the funds to cover your immediate bills with cash to spare. A negative number is a major red flag—it suggests you don’t have the liquid cash to meet your obligations, which can get you into trouble fast.
For a growing agency or consultancy, having a healthy amount of working capital is what allows you to hire that new designer or invest in a new project management tool without having to take on more debt.
To see these ratios in action, let’s compare two hypothetical marketing agencies. Notice how just a few key numbers can paint two very different pictures of financial health.
Financial Health Check: A Tale of Two Agencies
| Metric | Healthy Agency | Struggling Agency | What It Indicates |
|---|---|---|---|
| Current Ratio | 1.8 | 0.9 | The healthy agency has $1.80 in assets for every $1 of debt, a strong cushion. The struggling one can’t cover its immediate bills. |
| Debt-to-Equity Ratio | 0.5 | 3.0 | The healthy agency is funded mainly by its owners. The struggling one relies heavily on debt, making it much riskier. |
| Working Capital | $80,000 | -$10,000 | The healthy agency has cash for operations. The struggling one is in a deficit and may face a cash crunch soon. |
As you can see, the numbers tell a clear story. The “Healthy Agency” has a solid foundation, while the “Struggling Agency” is showing classic signs of financial distress that need immediate attention.
By regularly calculating these three key metrics, you’ll move beyond just reading your balance sheet. You’ll start using it as a strategic tool to make smarter, more confident decisions for your business. To go even deeper, it’s worth learning how to analyze financial data like a pro.
Turning Your Balance Sheet Into Business Decisions
Your balance sheet isn’t just another report for your accountant. Think of it as a powerful diagnostic tool for your business. The real magic happens when you move past simply reading the numbers and start using them to ask tough questions and make strategic moves. This is the moment your financial data becomes your best guide for making confident, smart decisions.
An analysis is only as good as the action it inspires. The goal here is to shift from passively knowing your financial position to actively improving it. That means spotting warning signs early and responding with a clear, decisive plan.
Spotting Red Flags in Your Financials
Long before a problem becomes a full-blown crisis, your balance sheet will start flashing warning signals. Knowing what to look for is half the battle. For service businesses, a few specific red flags pop up all the time and demand immediate attention.
Here are some of the most critical warning signs to keep an eye on:
- Growing Accounts Receivable with Shrinking Cash: This is the classic “asset-rich, cash-poor” trap. If your AR balance is climbing while your bank account is draining, it’s a huge sign you aren’t collecting payments fast enough to cover your day-to-day costs. Something in your invoicing or collections process is broken.
- A Declining Current Ratio: When your current ratio dips consistently below 1.5, you have very little financial wiggle room. A single late payment from a big client or one unexpected expense could suddenly leave you unable to make payroll or pay a critical vendor.
- Steadily Increasing Debt-to-Equity Ratio: While taking on some debt can be a smart way to fuel growth, a ratio that creeps higher month after month is a problem. It suggests you’re becoming too reliant on creditors, which ramps up your financial risk and can make it much harder to get a loan down the road.
These aren’t just abstract numbers on a page; they are direct indicators of your business’s health. Ignoring them is like ignoring the check engine light in your car—the problem is only going to get worse.
Taking Action Based on What You See
Once you’ve spotted a potential issue, the next move is to build a concrete action plan. The good news is that your balance sheet doesn’t just point out problems; it also hints at the solutions.
Your balance sheet tells a story about where your business is right now. Your job as the owner is to write the next chapter by taking decisive action based on that story.
Let’s say you see the red flag of high AR and low cash. Your action plan could look something like this:
- Tighten Your Collections Process: The first thing you should do is run an AR aging report in QuickBooks. Immediately start following up on every invoice over 30 days past due, starting with the biggest ones first.
- Adjust Your Invoicing Terms: Think about requiring a 50% deposit upfront for new projects. This dramatically improves your cash flow from the very start. You could also try offering a small discount for clients who pay early.
- Automate Your Reminders: Most invoicing software lets you set up automated payment reminders. Use them. A gentle, automated nudge before and after an invoice is due can work wonders.
If a rising debt-to-equity ratio is your main concern, your plan will look different. You might explore refinancing a high-interest loan to lower your monthly payments or create a plan to aggressively pay down credit card balances. The key is to connect the data you see directly to a specific, measurable action.
When to Call in a Professional
Sometimes, the red flags on your balance sheet are confusing, or maybe the numbers just don’t seem to add up. If you’re struggling to make sense of what you’re seeing—or if the report itself looks messy and unreliable—that’s a clear sign it’s time to get some expert help.
Trying to make critical business decisions with inaccurate financial data is like flying blind. It’s incredibly risky. A professional bookkeeping firm like Steingard Financial can step in to clean up your historical records, make sure your chart of accounts is structured correctly, and deliver the clear, timely financial statements you need to lead.
Ultimately, the goal is to turn your financial data from a source of stress into a source of confidence. When you know how to read your balance sheet and act on its insights, you’re no longer just reacting to your business—you’re strategically guiding it toward lasting growth.
A Few Lingering Questions About Balance Sheets
Even after you get the hang of reading a balance sheet, a few practical questions almost always pop up. Getting clear, straightforward answers is the final step to feeling truly in control of your business’s finances. Let’s tackle some of the most common ones we hear from service business owners.
My goal here is to clear up any lingering confusion so you can move from just reading this report to actually using it to make smarter decisions.
How Often Should I Be Looking at My Balance Sheet?
For most service-based businesses, reviewing your balance sheet monthly is the perfect rhythm. It’s frequent enough to spot important trends and potential issues early on, but not so often that it becomes a burden. When you pair a monthly balance sheet review with your income statement, you get a complete and timely picture of your financial health.
However, there are exceptions. If your business is in a major growth spurt or you’re navigating a tight cash situation, you should probably bump that up to a weekly review. This gives you a much tighter grip on your financial position when things are moving fast. Most professional bookkeepers, like our team, will provide these month-end statements automatically, making it easy to stay in a consistent review habit.
Why Don’t My Assets Equal My Liabilities Plus Equity?
If your balance sheet doesn’t balance, that’s a major red flag. It’s a sure sign of a bookkeeping error somewhere in your records. The whole system is built on that fundamental accounting equation: Assets = Liabilities + Equity. When it’s out of whack, the data is wrong.
What usually causes this? It’s often one of a few common culprits:
- Simple data entry mistakes: A typo or a misplaced decimal point can throw the whole thing off. It happens.
- Incorrectly categorized transactions: Maybe a loan payment was recorded as a simple expense instead of being split between principal (a liability) and interest (an expense).
- Single-entry errors: A transaction was only half-recorded. For instance, you logged a payment for a bill but forgot to also reduce your cash balance.
A balance sheet that doesn’t balance isn’t a small quirk; it means the financial data you’re relying on is fundamentally flawed. This is a critical problem to fix. A professional can quickly perform a review to find and correct the source of the error.
What’s the Real Difference Between a Balance Sheet and an Income Statement?
I love a good analogy for this one. Think of it this way: the balance sheet is a photograph, and the income statement is a movie.
The balance sheet is a snapshot. It captures your company’s financial position—what you own and what you owe—on one specific day.
The income statement (often called a Profit & Loss or P&L) tells a story over time. It shows your company’s performance—your revenue, expenses, and profit—over a period, like a month or a quarter. You absolutely need both to get the full picture. One shows your stability, and the other shows your profitability.
Is It Possible to Have High Equity but No Cash?
Yes, absolutely. This is a surprisingly common—and dangerous—trap for service businesses. Your equity can look fantastic on paper if you have valuable assets or high retained earnings from profitable years.
But if all your money is tied up in unpaid client invoices (a high accounts receivable balance), or you have huge immediate expenses like payroll coming due, you can face a serious cash crunch. This is precisely why you can’t just look at one number. You have to analyze your balance sheet alongside your cash flow statement and pay very close attention to liquidity ratios like the current ratio. That’s what tells you if you can actually pay your short-term bills.
If you’re staring at your financial reports and they’re creating more questions than answers, it might be time for some expert support. The team at Steingard Financial specializes in delivering accurate, timely bookkeeping that gives service business owners the confidence to make smart decisions and drive growth. Learn how we can help you build a solid financial foundation.