


What is financial statement analysis? A Practical Guide to Financial Health
Financial statement analysis is just the process of reviewing your company’s financial reports so you can make better, smarter business decisions. Think of it as a health check-up for your business, taking all those complex numbers and turning them into a clear action plan for growth and stability.
Decoding Your Business Story

You can think of your company’s financial statements as different chapters in an ongoing book. By themselves, they’re just lists of numbers—revenue, expenses, assets, and liabilities. But when you learn how to read them together, they tell the real story: where your business has been, its current financial health, and where it’s likely headed.
Learning how to analyze these statements moves you beyond just collecting data. It empowers you to generate real, actionable intelligence. Suddenly, you can answer the critical questions that every service business owner faces:
- Are we pricing our services for maximum profitability?
- Do we have enough cash on hand to cover payroll and upcoming bills?
- Is our client acquisition strategy actually paying off?
- How are we performing this quarter compared to last year?
The Main Characters in Your Financial Narrative
To truly understand the big picture, you need to get familiar with the three main characters in your business’s financial story. Each report offers a unique window into your company’s performance and overall health.
Here’s a quick rundown of the three core financial statements and what they tell you.
The Three Core Financial Statements at a Glance
| Financial Statement | What It Tells You | Key Question Answered |
|---|---|---|
| Income Statement | Shows your company’s profitability over a specific period (like a month or quarter). | “Did we make a profit?” |
| Balance Sheet | Provides a snapshot of your company’s financial position at a single point in time. | “What do we own and what do we owe?” |
| Cash Flow Statement | Tracks the movement of cash in and out of your business. | “Where did our cash come from and where did it go?” |
Getting comfortable with these three reports is the absolute foundation of solid financial management.
Trying to run your business by looking at just one of these statements is like trying to read a book by only looking at every third page. You’ll get bits and pieces of the story, but you’ll miss the crucial context that ties it all together.
By analyzing these documents as a whole, you can start to diagnose problems before they get out of hand, spot opportunities for growth, and build a more resilient, profitable business.
Of course, before you can analyze them, you have to be sure they’re prepared correctly. For a refresher, check out our guide on how to prepare financial statements. This guide will focus on the next step: the analysis itself, showing you how to turn that raw data into your biggest strategic advantage.
The Four Core Methods of Financial Analysis

Once your financial statements are ready, the real work begins. This isn’t about just staring at a spreadsheet, hoping for an epiphany. It’s about using proven techniques to pull back the curtain and understand the story your numbers are telling.
There are four main methods analysts use to turn raw data into valuable insights. Think of them like a mechanic’s toolkit. You wouldn’t use a wrench to check tire pressure, right? Each analysis method is built for a specific job, helping you answer different questions about your company’s performance, health, and future.
Horizontal Analysis: Spotting Trends Over Time
Horizontal analysis, often called trend analysis, is like watching a game replay of your company’s finances. You line up financial data from different periods—like this quarter vs. last quarter, or this year vs. last year—to see how things have changed. This is how you spot momentum, identify patterns, and catch small issues before they become big problems.
For a service business, you might track revenue growth. Seeing a 15% revenue increase over the last year is great, but horizontal analysis helps you ask why. Was the growth steady, or did it all come from one big project?
The formula is simple:
- (Current Period Amount – Prior Period Amount) / Prior Period Amount * 100
This gives you a percentage change, making it easy to see if you’re growing or shrinking in key areas like sales, service costs, or overhead.
Vertical Analysis: Seeing the Big Picture
While horizontal analysis looks across time, vertical analysis drills down into a single period. It takes each line item on a financial statement and shows it as a percentage of a major total. On the income statement, everything is shown as a percentage of total revenue. For the balance sheet, each item is a percentage of total assets.
This approach is like figuring out each player’s contribution to the team’s final score. It instantly shows you the relative size of your costs and where your resources are allocated.
For example, a service business might use vertical analysis and see that its cost of services is 40% of total revenue. If that number creeps up to 50% the next year, it’s a red flag. Even if total revenue is growing, your profitability on each project is shrinking.
This is also a fantastic way to compare your business to others in your industry, even if they’re much larger or smaller, because it focuses on proportions, not raw dollar amounts.
Ratio Analysis: Diagnosing Financial Health
Ratio analysis is the most detailed diagnostic tool in the kit. It involves calculating specific financial ratios to get a clear read on different aspects of your company’s performance. These ratios are usually grouped into categories that answer very specific questions.
Here are the key categories of financial ratios:
- Liquidity Ratios: Do you have enough cash to cover your immediate bills? The Current Ratio (Current Assets / Current Liabilities) is a classic example.
- Profitability Ratios: How good are you at turning revenue into actual profit? The Gross Profit Margin (Gross Profit / Revenue) is a must-watch for service businesses.
- Efficiency Ratios: How well are you using your assets to generate sales and profits?
- Solvency Ratios: Can your company meet its long-term debt obligations?
Using ratios gives you a standard way to measure performance year after year. It’s not just a gut feeling; it’s data. In fact, S&P 500 firms that consistently improved their profit margins saw average annual returns of 12.5% between 2010 and 2020, far outpacing the 7.2% for those who didn’t. To learn more, you can explore findings on how analysts use historical financial statements.
Cash Flow Analysis: Tracking Your Lifeblood
Finally, we have cash flow analysis, which focuses only on the movement of cash. Your income statement can show a healthy profit, but that doesn’t mean you have cash in the bank—a critical lesson for every business owner. This analysis digs into your cash flow statement to see exactly where cash is coming from and where it’s going.
It breaks everything down into three buckets:
- Operating Activities: Cash from your core business operations.
- Investing Activities: Cash spent on or generated from big purchases, like equipment.
- Financing Activities: Cash from loans and investors, or cash used to pay them back.
For any service business, strong operating cash flow is the ultimate sign of a healthy company. If you’re profitable on paper but your operating cash flow is negative, it could mean you’re not collecting payments from clients fast enough. Mastering these four methods gives you a complete framework to truly understand your business from the inside out.
How to Perform Financial Statement Analysis
Knowing the theory behind financial analysis is one thing, but actually rolling up your sleeves and doing it is another. The great news? You don’t need to be a CPA to get started. By following a clear, structured process, any service business owner can turn stacks of raw financial data into a powerful tool for making smarter decisions.
Let’s walk through the process, step by step. To keep things grounded in the real world, we’ll use a hypothetical marketing agency as our example. This playbook will guide you from gathering the right documents all the way to making strategic moves based on what the numbers tell you.
Step 1: Gather Your Essential Documents
Before you can analyze anything, you need the right raw materials. Think of this as your pre-flight checklist. Trying to perform an analysis with incomplete or fuzzy numbers is a recipe for disaster—a classic case of “garbage in, garbage out.”
Your first task is to round up these three core financial statements for the period you want to look at:
- The Income Statement: This report shows your agency’s profitability over a specific time, like the last quarter or the entire previous year.
- The Balance Sheet: This gives you a snapshot of what your agency owns (assets) and what it owes (liabilities) on a single day. To get a better handle on its different parts, you might want to check out our detailed guide on how to read a balance sheet.
- The Cash Flow Statement: This document tracks all the cash moving in and out of your business, revealing your true liquidity situation.
For a really meaningful analysis, especially if you’re looking for trends, you’ll want these documents for several periods in a row (for example, the last four quarters or the past two fiscal years). The real story starts to unfold when you have that historical context.
Step 2: Choose the Right Analysis Method
With your documents in hand, the next step is to decide what you actually want to learn. Each analysis method answers a different kind of question, so picking the right one is all about your goal.
Are you wondering how much your revenue has grown over the last year? Horizontal analysis is the tool for that job. Want to know if your project management costs are eating up too much of your revenue? Vertical analysis will give you the answer.
Let’s go back to our marketing agency. The owner wants to know if the agency is getting more or less profitable on its core services. This is a perfect job for a mix of vertical and ratio analysis. She decides to zero in on the Gross Profit Margin to see how much profit is left after paying for the direct costs of delivering client work.
Step 3: Calculate Key Ratios and Metrics
Now it’s time to crunch some numbers. Don’t worry—the formulas are pretty straightforward, and the insights they unlock are well worth the small effort. For our marketing agency, the owner is focusing on the Gross Profit Margin, which is a critical KPI for any service business.
The formula is simple:
Gross Profit Margin = (Total Revenue – Cost of Goods Sold) / Total Revenue * 100
In a service business like a marketing agency, “Cost of Goods Sold” (COGS) is usually called “Cost of Services” or “Cost of Revenue.” This includes all the direct costs of delivering work to your clients, such as:
- Salaries for your service team (designers, writers, strategists)
- Fees for freelancers or contractors
- Software subscriptions used directly on client projects (like a social media scheduling tool)
Let’s say the agency’s income statement shows $500,000 in revenue and $200,000 in cost of services.
Here’s the calculation:
- ($500,000 – $200,000) / $500,000 = 0.60
- 0.60 * 100 = 60%
This means that for every dollar of revenue the agency brings in, it keeps 60 cents after paying for the direct costs of its services. That 60 cents is what’s left to cover all other operating expenses—like rent, marketing, and admin salaries—and hopefully, leave a healthy profit.
Step 4: Interpret the Results and Make Decisions
A number like a 60% Gross Profit Margin is meaningless by itself. The final, and most important, step is to interpret that figure and turn it into an actionable business decision. Context is everything.
The agency owner compares this 60% margin to previous periods. She discovers that last year, the margin was 68%. That’s a pretty significant drop and a major red flag. Even though revenue grew, the profitability on each project actually went down. This is exactly the kind of critical insight that financial statement analysis is designed to uncover.
Now, she can start asking the right questions:
- Pricing: Are we underpricing our new service packages?
- Efficiency: Is our team spending too much time on certain projects, driving up labor costs?
- Scope Creep: Are we giving away “free” work that isn’t accounted for in our original project scope?
- Resource Mix: Have we started relying too heavily on expensive contractors instead of our in-house team?
Based on this analysis, the owner decides to review the agency’s pricing structure and put stricter project management rules in place to get a handle on scope creep. These aren’t just gut feelings; they are strategic decisions backed by hard financial data. This four-step process—gather, choose, calculate, and interpret—is the repeatable engine for turning your financial statements from a boring compliance chore into your most valuable strategic asset.
Essential Financial KPIs for Service Businesses
Not all metrics are created equal, especially when your primary product is expertise or labor. While a retailer might obsess over inventory turnover, a service business thrives on completely different indicators of health. Focusing on the right Key Performance Indicators (KPIs) is what separates businesses that just get by from those that are truly profitable and efficient.
The process is pretty straightforward. You gather your financial documents, analyze them for key data points, and then use those insights to make smart, informed decisions for the future.
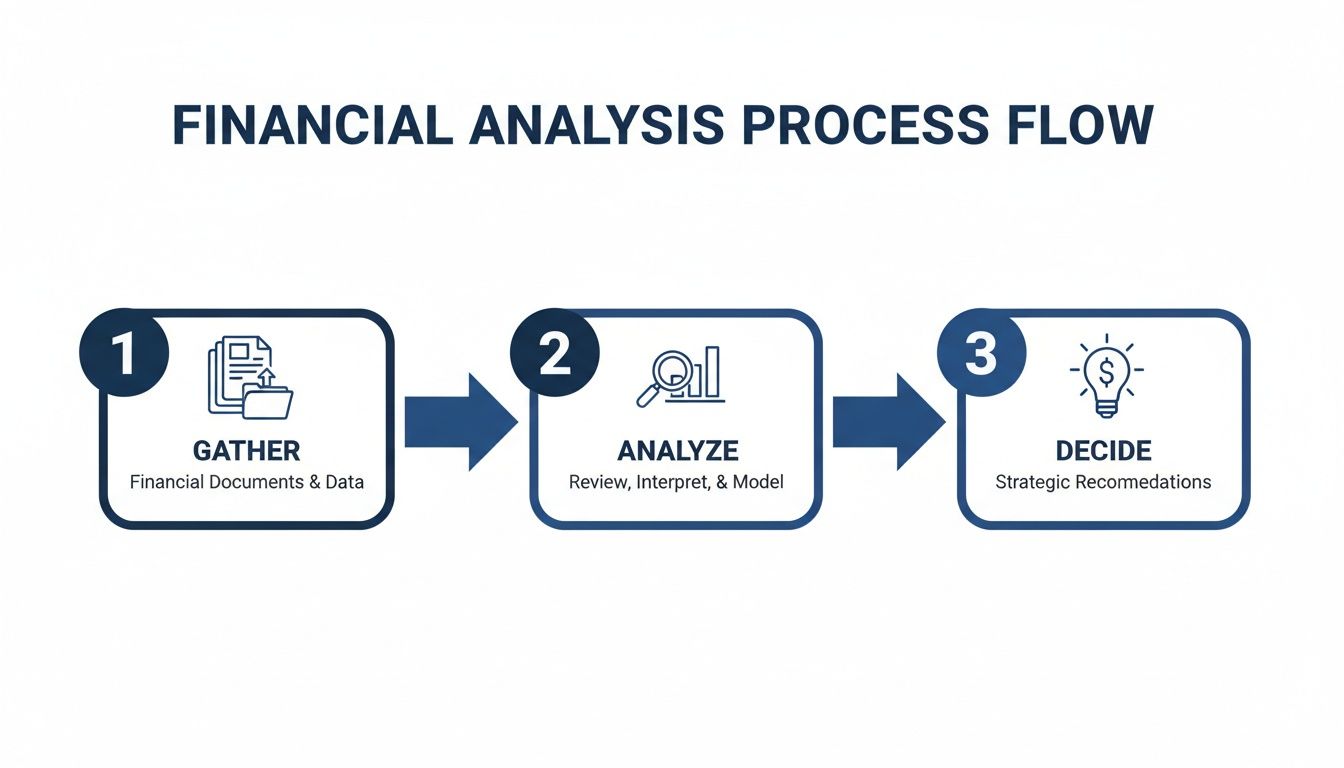
This simple flow—gather, analyze, decide—is the engine that turns raw numbers into a real strategic advantage for your company.
Once you move beyond basic revenue tracking, you can build a meaningful performance dashboard that tells the full story of your business’s health. Let’s dig into the KPIs that matter most for businesses that sell services, not physical products.
To give you a clear overview, here’s a table breaking down the most important financial KPIs for service-based businesses.
Essential KPIs for Service-Based Businesses
| KPI (Key Performance Indicator) | Formula | What It Measures |
|---|---|---|
| Gross Profit Margin | (Total Revenue – Cost of Services) / Total Revenue | The core profitability of your services before accounting for overhead costs. |
| Days Sales Outstanding (DSO) | (Accounts Receivable / Total Credit Sales) x Number of Days in Period | The average time it takes to get paid after a sale, reflecting your collection efficiency. |
| CLV to CAC Ratio | Customer Lifetime Value (CLV) / Customer Acquisition Cost (CAC) | The return on investment for your sales and marketing efforts. |
These metrics provide a powerful snapshot, helping you understand not just how much money you’re making, but how efficiently you’re operating and whether your growth is sustainable.
Measuring Profitability and Pricing Power
Profitability KPIs cut straight to the chase: are you actually making money on the services you provide? They are the first and most critical health check for your business model and pricing strategy.
A prime example is the Gross Profit Margin. This is arguably the most vital metric for any service business. It measures the profitability of your core offerings before you even think about overhead like rent or marketing. A high margin means your pricing is strong and your service delivery is efficient. Service businesses should aim for a gross profit margin of 50% or higher, though this can vary by industry. A declining margin is a serious red flag that needs immediate attention.
Gauging Cash Flow and Collection Efficiency
Profit on paper is great, but cash in the bank pays the bills. These KPIs measure how effectively you manage the lifeblood of your business—your cash. They give you a clear view of your liquidity and operational health.
Days Sales Outstanding (DSO) tells you the average number of days it takes to collect payment after you’ve completed your work. A high DSO means your cash is tied up in your clients’ pockets, not yours. You should aim for a DSO under 45 days—the lower, the better. A rising DSO can be an early warning sign of upcoming cash flow problems. You can learn more about managing cash flow with our guide to cash flow calculation.
While we’re on the topic, understanding the Debt Service Coverage Ratio (DSCR) is also vital for assessing a business’s ability to cover its debt obligations.
Evaluating Customer Value and Marketing ROI
How do you know if your marketing and sales efforts are truly paying off? These KPIs connect your customer acquisition costs to the long-term value those customers bring, ensuring your growth is actually sustainable.
By focusing on the relationship between acquiring a customer and their lifetime value, you shift from simply spending on marketing to strategically investing in profitable growth.
The Customer Lifetime Value (CLV) to Customer Acquisition Cost (CAC) Ratio is a powerhouse metric. It compares the total value a customer brings over their entire relationship with you to what it cost to get them in the door. A healthy CLV to CAC ratio is typically 3:1 or higher. If your ratio is 1:1, you’re just breaking even, which isn’t a sustainable growth model. Anything below that means you’re losing money on every new client you bring in.
By consistently tracking these essential KPIs, you transform your financial statements from simple historical records into a forward-looking navigation system for your service business.
Common Financial Analysis Pitfalls to Avoid
Financial statement analysis can feel like you’ve suddenly gained a superpower, giving you x-ray vision into the real health of your business. But like any good superhero story, this power comes with a few traps for the unwary. Falling into these common pitfalls can twist your insights into bad advice, leading you down the wrong path.
The first and most critical mistake is the old “garbage in, garbage out” problem. Your analysis is only as good as the numbers you start with. If your bookkeeping is a mess—think miscategorized expenses or accounts that haven’t been reconciled—any ratio or trend you calculate is built on a shaky foundation. It’s like trying to build a house on sand; it’s doomed to fail from the start.
Ignoring the Complete Financial Picture
One of the easiest traps to fall into is focusing only on the Income Statement. It’s tempting, of course, because it answers that big, exciting question: “Are we profitable?” But profit is not the same as cash. A service business can look incredibly profitable on paper while being just a few weeks away from not being able to make payroll. This happens all the time when you have a lot of sales on credit but are slow to actually collect the cash from your clients.
To get the real story, you have to look at all three statements together:
- Income Statement: This tells you about your profitability.
- Balance Sheet: This shows you what you own versus what you owe, giving a snapshot of your stability.
- Cash Flow Statement: This reveals the truth about your cash position.
Looking only at the income statement is like a doctor checking a patient’s temperature but ignoring their blood pressure and heart rate. You’re missing vital signs needed for an accurate check-up.
Using the Wrong Benchmarks
Another major pitfall is comparing your business to the wrong standard. It’s great to know your gross profit margin is 45%, but what does that number really mean? If you run a marketing agency where the industry average is 60%, your 45% suddenly looks like a problem that needs fixing. On the other hand, if you’re in a high-volume, low-margin industry, 45% might be fantastic.
Context is everything in financial statement analysis. Without comparing your metrics to industry averages or your own historical performance, a number is just a number—it lacks the meaning needed to drive smart decisions.
This is exactly why generic, one-size-fits-all financial advice rarely helps. You need to find data that’s relevant to your specific industry, business size, and service model. This ensures you’re measuring your performance against a meaningful yardstick, not just a random one. Avoiding these traps—by starting with clean data, looking at the whole picture, and using the right context—is what turns financial analysis from a guessing game into a powerful strategic tool.
Turning Financial Analysis Into a Growth Engine
When you consistently analyze your financial statements, you’re doing more than just crunching numbers—you’re shifting your business from reactive to proactive. It’s the difference between driving while looking only in the rearview mirror and using a real-time GPS to see what’s ahead. This all starts with a foundation of pristine bookkeeping and timely reporting, turning your back office from a cost center into a powerful asset.
With accurate and organized numbers, you get a clear, unobstructed view of how your company is truly performing. Your chart of accounts and a dashboard of key KPIs become your command center. You’re no longer guessing if that new service line is profitable or if a marketing campaign is paying off; you know the answers because the data is telling you.
From Confusion to Confident Leadership
This is where scalable, predictable growth happens—when you start integrating this financial intelligence into your daily operational decisions. Every choice, from hiring a new team member to investing in software, is backed by a solid understanding of its financial impact. This isn’t just theory; it’s a proven method for benchmarking your performance and staying competitive.
For example, ratio analysis shows you exactly how you stack up. Top US service firms saw their average current ratio climb from 1.4 in 2019 to 1.8 in 2022, a clear signal of stronger short-term financial health. Digging deeper, historical data shows that Fortune 500 companies that kept a debt-to-equity ratio below 1.0 grew their revenues 9% faster than their peers. To see more on this, check out this guide to historical financial performance analysis.
Financial statement analysis closes the gap between what you think is happening in your business and what is actually happening. It replaces gut feelings with data-driven confidence.
Ultimately, this whole process paves a clear path from financial confusion to confident leadership. The goal is to get to a place where every number tells a story, guiding you on where to focus your energy and resources. At Steingard Financial, we help you build that solid foundation of bookkeeping and reporting, making sure every decision you make is an informed one that propels your business forward.
Frequently Asked Questions About Financial Analysis
Once you start digging into your financial statements, it’s natural for a few questions to pop up. Here are some of the most common ones we hear from business owners who are just getting their feet wet with financial analysis.
How Often Should I Analyze My Financials?
For most service businesses, we recommend a detailed monthly review. This rhythm is frequent enough to spot trends or catch small issues before they snowball into major headaches. It lets you make smart, timely tweaks to your strategy.
On top of that, a quarterly deep dive is crucial. This is your chance to zoom out and run more thorough horizontal and vertical analyses. You can see the bigger picture, measure your progress against your annual goals, and make more significant strategic decisions.
What Is the Difference Between Bookkeeping and Analysis?
This is a really important distinction, and it’s one a lot of people mix up. Here’s a simple way to think about it:
Bookkeeping is the act of accurately recording and organizing your financial transactions—it’s about creating the history book. Financial analysis is the act of reading that history book to understand the story it tells and using it to write the next chapter.
Bookkeeping gives you clean, reliable data. Analysis is what turns that raw data into real business intelligence. You absolutely need both, but they serve two totally different purposes. One documents what happened; the other helps you decide what happens next.
Can I Just Use QuickBooks for Financial Analysis?
QuickBooks is a fantastic tool for the first part of the equation: bookkeeping. It’s great for generating your core financial statements and can even spit out some basic reports and standard ratios to get you started.
But true financial analysis requires a layer of interpretation and business context that software just can’t provide. QuickBooks will tell you the “what”—for example, that your profit margin is 35%. What it can’t tell you is the “why” behind that number or guide you on the “what’s next.” That’s where human insight and strategy come in.
Understanding your numbers is the first step toward building a more resilient and profitable business. The team at Steingard Financial specializes in providing the pristine bookkeeping and insightful reporting that service businesses need to thrive. Ready to turn your financial data into your biggest asset? Visit us at https://www.steingardfinancial.com.