Reading a cash flow statement is like getting the real story behind your business's bank account. It breaks down the narrative into three core parts: where cash came from (and went) in your daily operations, how you're using cash for long-term growth, and how you're funding the entire operation through debt or equity.
This statement explains the crucial difference between the profit you see on paper and the actual cash you have on hand.
Your Quick Guide to the Cash Flow Statement
Have you ever looked at your Profit and Loss statement, seen a healthy profit, and then glanced at your bank balance with utter confusion? It's a classic, and frustrating, experience for many service business owners. The cash flow statement is the report that finally connects those two dots, showing you exactly where your money went.
Unlike your income statement, which works on an accrual basis (meaning it records revenue when you earn it, not when you get paid), the cash flow statement is all about the real-time movement of cash. It gives you an honest look at the financial reality of your business.
This report is so critical that it became a mandatory part of U.S. financial reporting back on July 15, 1988, when FASB Statement No. 95 was issued. It replaced a much vaguer report with a clear breakdown of cash movements, and for good reason. Even today, you'll find large S&P 500 companies that report positive net income but have negative operating cash flow—a clear sign of a working capital problem that can just as easily sink a small service business.
Why This Statement Is Crucial for Service Businesses
For any service-based company, understanding your cash flow statement isn't just a bookkeeping task—it's a survival skill. Your business model often has a built-in delay between when you deliver a service and when the payment hits your account. This can create serious cash crunches, even when you're technically profitable.
This statement provides the visibility you need to answer critical questions with confidence:
- Do we have enough cash reserves to hire a new team member right now?
- Can we actually afford that new software subscription or equipment upgrade?
- Are our clients taking longer to pay their invoices than they did last quarter?
The document tells this story through three distinct sections. Below is a quick rundown of what each one means for your business.
The Three Sections of the Cash Flow Statement Explained
This table summarizes the three activities you'll find on every cash flow statement and what they tell you about your business's health.
| Section | What It Shows | Example for a Service Business |
|---|---|---|
| Cash Flow from Operating Activities | Cash generated by your primary business functions. | Collecting payments from clients, paying salaries, and office rent. |
| Cash Flow from Investing Activities | Cash used to buy or sell long-term assets that help your business operate and grow. | Buying new laptops for your team or selling an old company vehicle. |
| Cash Flow from Financing Activities | Cash from taking on debt, owner investments, or paying back loans. | Taking out a business loan or making a principal payment on one. |
By getting comfortable with these three sections, you can move from just looking at numbers to making truly strategic decisions.
If you want to build your own statement for analysis, a good template is the best place to start. Check out our guide on creating a cash flow statement format in Excel. And to really put these insights to work, consider exploring strategies for Mastering Cash Flow Planning to turn what you've learned into a powerful action plan.
Decoding Cash Flow from Operating Activities
Let's start with what I consider the financial heartbeat of your service business: cash flow from operating activities, or CFO. This section of the statement gets right to the point. It answers the most critical question: did your core, day-to-day business operations actually bring in more cash than they spent?
When you’re learning to read a cash flow statement, this is the most important piece of the puzzle.
Most accounting software, including QuickBooks, defaults to what's called the indirect method for this calculation. It's the standard for a reason—over 95% of companies use this approach. Instead of painstakingly tracking every dollar in and out, the indirect method starts with your Net Income (from the P&L) and adjusts it back to reflect your true cash position.
This diagram shows how your operations fit into the bigger picture, feeding into your investing and financing activities to create a full cycle.
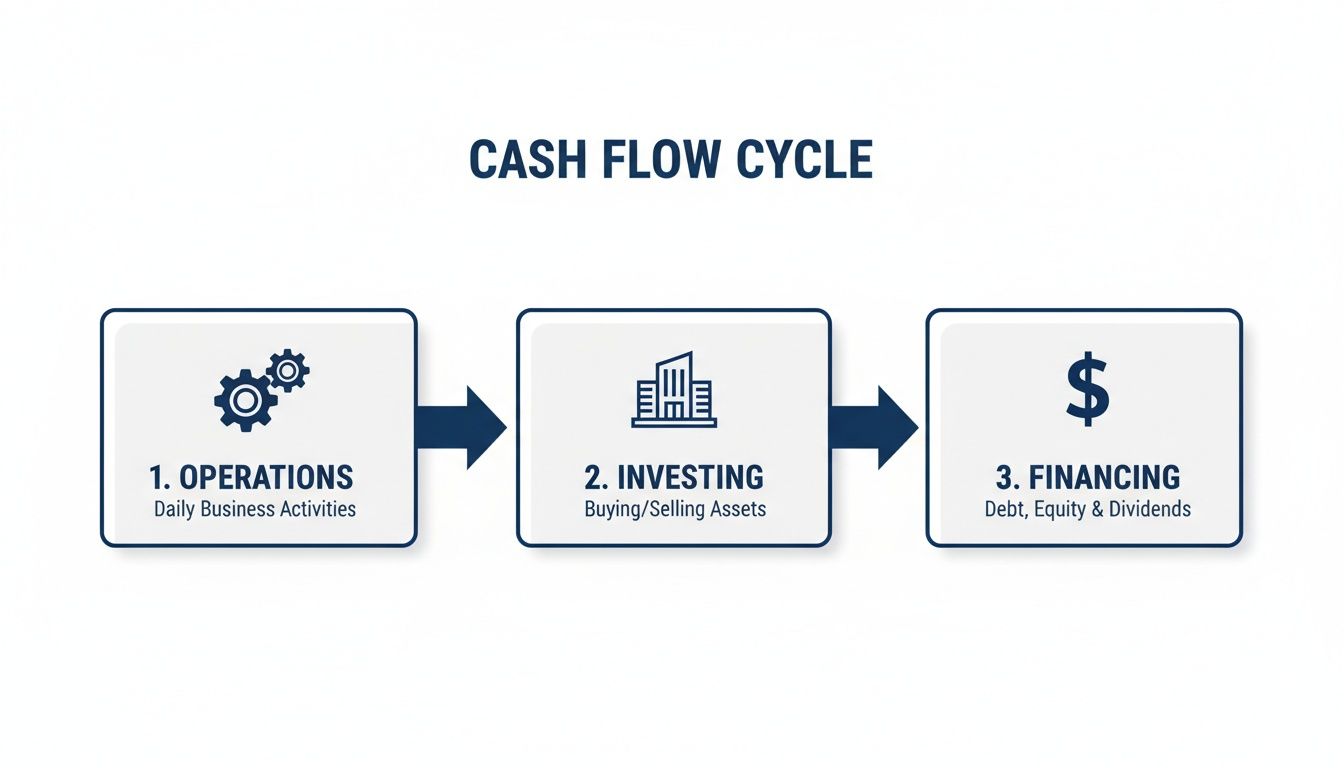
Essentially, the cash you generate from your core business can be put back to work through investments or used to pay down debt, creating a loop that keeps your business running.
Starting with Net Income
The very first line you’ll see under operating activities is always Net Income. Think of this as your starting point. From there, the statement begins to add back any non-cash expenses that were originally subtracted on your P&L.
Depreciation is the classic example here. Say you bought a new computer for $2,000. Your P&L won't show that full expense at once. Instead, you might see a monthly depreciation expense of $40. But here's the key: no actual cash left your bank account for that $40 expense. To get an accurate picture of cash, we have to add it back to net income.
Key Insight: The real story is in the adjustments between net income and operating cash flow. I’ve seen many service firms that are highly profitable on paper but dangerously low on cash. This is a common trap, especially for growing businesses.
Adjustments for Working Capital
The next step is making adjustments for changes in your working capital, which is really just a fancy term for your current assets and liabilities. This part can trip people up, but the logic is actually pretty simple once you get it.
Let's focus on two accounts you're probably very familiar with:
- Accounts Receivable (AR): This is the money your clients owe you. If your AR balance goes up, it means you billed for more work than you collected in cash. That increase is "profit" you haven't been paid for yet, so we have to subtract it from net income to see the cash reality.
- Accounts Payable (AP): This is the money you owe your own suppliers. If your AP balance goes up, you've received services or goods but haven't paid the bill yet. This keeps cash in your bank account for a bit longer, so we add that increase back to net income.
A Real-World Scenario for a Consulting Firm
Let's put this into practice. Imagine your consulting firm had a great quarter, reporting a solid $50,000 in net income. Things are looking good! But then you look closer and see your Accounts Receivable grew by $40,000 in that same period because a couple of big clients are paying late.
Even though you’re "profitable," that $40,000 isn't in your bank account—it's in your clients'. Your cash flow statement will show this adjustment, painting a much less rosy picture of your immediate cash position. This disconnect is exactly why experienced investors and CFOs watch this metric like a hawk.
In fact, many financial pros consider Operating Cash Flow the most important indicator of a business's health. Surveys have found that 68% of CFOs call it the 'single most important figure,' even more so than net income. It proves you're not just making sales, but you're also good at collecting the cash.
For a deeper dive into the specific calculations, you can learn more about how to find your operating cash flow here: https://steingardfinancial.com/how-to-find-operating-cash-flow/. Ultimately, this number shows your business's ability to fund its own growth without constantly needing to look for outside money.
Analyzing Investing and Financing Activities
Beyond the day-to-day cash flow from your operations, your business uses money for two other key functions: investing in its future and financing its growth. The investing and financing sections of your cash flow statement reveal your long-term strategy—where you're placing your bets and how you're paying for everything.
To get the full financial picture, you have to look past the operational details. These next two sections show your company’s big-picture plans and overall financial structure.
Cash Flow from Investing
For a service business, the word "investing" can be a little confusing. This section isn't tracking your stock portfolio. It’s almost entirely about your Capital Expenditures (CapEx), which are your purchases of long-term assets that help you operate and grow.
Think of it as the money you reinvest into your company's core capabilities. Common examples for a service business include:
- Buying new laptops and monitors for your team.
- Purchasing significant software licenses intended to last several years.
- Investing in office furniture to accommodate a growing staff.
When you buy these assets, the money spent is recorded here as a cash outflow. Seeing a negative number in the investing section is not necessarily a bad sign. In fact, it often means you're putting money back into the business to support growth. For instance, spending $15,000 on new equipment could signal that you're gearing up to take on larger client projects.
On the flip side, if you sell an old company vehicle or some outdated equipment, the cash you bring in appears here as a positive inflow. For most service businesses, this number tends to be small; average capex is often around 0.8% of total revenue.
Key Takeaway: A consistently flat or zero balance in the investing section can be a red flag. It might suggest the business isn't modernizing its tools or scaling its infrastructure, which could hurt its competitiveness down the road.
Cash Flow from Financing
The financing activities section explains how your business gets its funding. It tracks the flow of cash between the company and its owners or lenders. This is where you’ll see the direct impact of raising capital or paying down debt.
Common transactions you'll find listed here include:
- Owner Contributions: Cash you personally put into the business. This shows up as a cash inflow.
- Owner Draws or Distributions: Money you take out of the business for personal use. This is a cash outflow.
- Loan Proceeds: Taking out a new business loan or drawing on a line of credit creates a cash inflow.
- Loan Repayments: The principal payments you make on existing debt appear as a cash outflow. (Remember, the interest portion is an operating expense, not a financing activity).
Let's walk through a practical scenario. Imagine a digital agency has a slow summer season. To cover expenses, the owner secures a $50,000 line of credit. When they draw those funds into the business account, that $50,000 is recorded as a positive cash flow from financing.
A few months later, when business is booming, they repay $10,000 of the principal. That payment will be shown as a ($10,000) outflow in this section.
Cash Flow from Investing vs. Financing Activities
It’s easy to get these two sections mixed up, but they tell very different stories. Investing is about buying assets to run the business, while financing is about getting the cash to fund the business itself. Here’s a quick comparison.
| Activity Type | Common Transactions | What It Tells You |
|---|---|---|
| Investing | • Purchase of new computers or equipment • Sale of an old company vehicle • Buying long-term software licenses |
How much you are reinvesting in the business's assets and infrastructure to support future growth. |
| Financing | • Owner puts personal cash into the business • Owner takes a draw • Receiving funds from a new loan • Paying down the principal on a loan |
How the business is capitalized—whether it’s funded by owners (equity) or lenders (debt), and if that is changing. |
When you analyze these activities together with your operations, you get a powerful, holistic view of your company. In fact, a full historical analysis can slash forecasting errors by up to 42%, helping you plan with much more confidence. You can find more detail on this critical step in an article on cash flow planning from XLReporting.
Ultimately, this part of the statement reveals your capital structure—how you balance debt and equity to fuel growth—and helps you ensure you don't become overleveraged.
Putting It All Together with Key Ratios and Red Flags

A cash flow statement is much more than a historical document to file away. Its real power comes from analysis—helping you go from just reading the numbers to truly understanding what they mean for the future of your business.
By calculating a few key ratios and knowing which red flags to watch for, you can turn this report into a powerful diagnostic tool. It's how you spot trouble before it hits your bottom line.
Calculating Your Most Important Cash Ratios
Two of the most insightful metrics you can pull from your statement are the Operating Cash Flow to Sales Ratio and Free Cash Flow (FCF). Each one tells a different but equally important story about your business’s performance.
First, the Operating Cash Flow to Sales Ratio is a quick health check. You just divide your total cash from operating activities by your total revenue for the same period. The resulting percentage shows you how much actual cash you generate for every dollar in sales. For service businesses, this averaged around 12.5% of revenue in 2025. A consistently high percentage means your core business is a cash-generating machine.
Then there's Free Cash Flow, which is arguably one of the most critical numbers for any business owner. FCF shows you the cash your company has left after covering both operating expenses and capital expenditures.
The formula is simple:
Free Cash Flow = Cash Flow from Operations – Capital Expenditures
Think of FCF as your business’s real, discretionary cash. It’s the money you have on hand to invest in growth, pay down debt, or take as an owner distribution without hurting daily operations. Healthy, growing FCF is a sure sign of a strong and financially flexible business.
Once you get a handle on the moving parts of your cash flow, tools like a cash flow calculator can help you forecast and manage your financial position much more effectively.
Spotting the Financial Red Flags
Knowing what looks good is one thing, but it's just as important to know what looks bad. Your cash flow statement can signal trouble long before it ever shows up on your P&L. You have to keep a close eye out for these common red flags.
A widening gap between your Operating Cash Flow (OCF) and EBITDA (Earnings Before Interest, Taxes, Depreciation, and Amortization) is a major warning sign. It often signals underlying issues with accounts receivable and collections that need immediate attention before they spiral out of control.
Here are some of the most critical warnings your statement might be giving you:
- Consistently Negative Operating Cash Flow: An occasional dip is one thing, but if your core operations are consistently burning more cash than they generate, your business model simply isn't sustainable. This holds true even if your income statement shows a profit.
- Heavy Reliance on Financing: Is cash from new loans or owner contributions constantly being used to cover operating shortfalls? This is a dangerous cycle that shows the business can't support itself.
- Ballooning Accounts Receivable: If your Net Income is growing but your operating cash flow is flat or falling, check your AR. This usually means you’re recording sales but failing to actually collect the cash from clients.
- Selling Assets to Cover Operations: Seeing positive cash flow from investing activities because you sold off equipment, paired with negative operating cash flow, is a classic sign of a business in distress. You're selling off your future just to pay for today.
- High Capital Expenditures Without Growth: Reinvesting in your business is smart, but it has to pay off. If you're consistently spending heavily on new assets (negative investing cash flow) without seeing a matching increase in revenue or operating cash flow, your investments aren't working.
Learning to spot these issues early gives you the chance to correct course before it's too late. For those who want to get ahead of these problems, our guide on mastering cash flow projection for service businesses can give you a forward-looking framework for proactive planning.
Your Month-End Cash Flow Review Checklist

Getting a handle on the different parts of a cash flow statement is a great first step. But the real power comes from making it a habit. A consistent monthly review is what turns this financial report from a simple look in the rearview mirror into a strategic tool you can use to navigate the road ahead.
This doesn't need to be a marathon session drowning in spreadsheets. We're talking about a focused, 30-minute routine at the end of each month that gives you real clarity and control. Here’s a practical checklist I use with my clients to guide them through the process.
Perform a Sanity Check Reconciliation
Before you even think about analysis, the very first thing you need to do is make sure the numbers are real. This simple check gives you confidence that the rest of your review is built on a solid, accurate foundation.
Go to the bottom of your cash flow statement and find the line "Cash and Cash Equivalents at End of Period." That number should exactly match the combined balance of all your business bank accounts and credit cards for the same date.
If they don't match, stop. Don't go any further. A mismatch means something is missing or miscategorized in your books, and any analysis you do will be based on faulty data.
Compare Operating Cash Flow to Net Income
This is arguably the most important comparison you can make on the statement. It cuts right to the chase and answers one critical question: "Did the profit I earned actually turn into cash in the bank?"
For this, you'll want to pull up your Profit & Loss statement and your Cash Flow statement and look at them side-by-side. Compare your Net Income to your Cash Flow from Operations (CFO).
- Are the two numbers relatively close? That's a great sign of efficient operations.
- Is your Net Income high, but your CFO is low or even negative? This is a classic red flag. It often means your Accounts Receivable are ballooning—you're making sales on paper, but you're not actually collecting the cash from your customers.
A healthy business should show Operating Cash Flow that consistently tracks with or even exceeds Net Income over time. A persistent gap is your earliest indicator of a potential cash crunch and a critical part of learning how to read a cash flow statement effectively.
Investigate Working Capital Changes
The space between your Net Income and your operating cash flow is where the story of your working capital lives. This is where you see how well you're managing the money owed to you versus the money you owe to others.
Zoom in on the changes in two key accounts:
- Accounts Receivable (AR): Did your AR balance go up a lot? This is a direct drain on your operating cash. It's a signal that clients may be paying you slower than usual, and it might be time to take a hard look at your collections process.
- Accounts Payable (AP): Did your AP balance increase? This means you held onto your cash a bit longer by stretching out payments to your vendors. While this gives you a temporary cash boost, you have to be careful not to strain those important supplier relationships.
Just a quick glance at these two lines tells you a powerful story about how quickly your business converts its activities into usable cash.
Analyze the Cash Flow Waterfall
I like to think of cash flow as a waterfall. Cash from your operations comes in at the top, and then you direct it to different pools for investing and financing. Your next step is to follow that flow.
Start with your "Net Cash Provided by Operating Activities." Let's say it's $50,000.
Next, look at your investing activities. If you spent $10,000 on new equipment or software, that cash had to come from somewhere. Ideally, it came from the cash your core business generated.
Finally, review your financing activities. If you made a $5,000 principal payment on a business loan, that cash also had to be sourced. When you see your operations are strong enough to fund both new investments and debt payments, it's a sign of a very healthy and sustainable business.
Calculate Your Free Cash Flow
This final step is the most empowering because it calculates the true discretionary cash your business generated. Free Cash Flow (FCF) is the money you have left over to pursue growth, pay out distributions, or build up your cash reserves.
The formula is pretty simple:
Free Cash Flow = Cash Flow from Operations – Capital Expenditures
Your "Capital Expenditures" are simply the funds you used to buy long-term assets, which you'll find in the investing activities section. Using our example, if your CFO was $50,000 and you spent $10,000 on new computers (a capital expenditure), your Free Cash Flow is $40,000.
Tracking this number every month gives you a clear, honest measure of your financial flexibility. When your FCF is positive and growing, you have the resources to make strategic moves with confidence, turning your monthly review into a true engine for growth.
Common Cash Flow Questions Answered
Even after you get the hang of the three main sections, some practical questions always seem to pop up. It's one thing to understand the theory, but it's another to apply it to your own business day-to-day.
Let's walk through some of the most common sticking points business owners run into when they start really digging into their cash flow.
What Is the Difference Between the Direct and Indirect Method?
You might hear accountants talk about two ways to prepare the operating activities section: the direct method and the indirect method. They both get to the same bottom-line number, but they take completely different routes.
The Direct Method is just what it sounds like. It lists out all your cash coming in (cash from customers) and all your cash going out (payments to suppliers, payroll, etc.). It’s very literal and easy to understand conceptually.
The Indirect Method is the one we've been using. It starts with your Net Income from the P&L and then works backward, adding and subtracting things to get to your actual cash number.
So, which one matters for you? Honestly, the indirect method is the only one you need to master. Over 95% of companies use it, and it's the default method in accounting software like QuickBooks. The direct method is a pain to put together, so while it's a good concept to know, the indirect method is what you'll be working with.
Why Is My Business Profitable but My Cash Flow Is Negative?
This is the classic, million-dollar question. It has confused (and terrified) countless business owners. The answer comes down to the gap between accrual accounting—what your P&L is based on—and the actual cash in your bank account.
Your P&L records revenue when you earn it. Your cash flow statement only cares about when the cash hits your account.
Think about it this way: your marketing agency lands a huge $100,000 contract in December. Your P&L for the year looks amazing, showing a massive profit. But the client's payment terms are Net 60, which means you won't actually see that cash until February. On paper, you're profitable. In reality, your bank account is waiting.
The reverse is also true. Let's say you pay your $12,000 annual insurance premium in January. That’s a $12,000 hit to your cash balance right away. Your P&L, however, spreads that out, showing only a $1,000 expense each month. This disconnect is exactly why your cash flow statement is so critical for survival.
This exact situation—high paper profits but low bank balances—is a primary cause of cash crunches for growing service businesses. It highlights the critical importance of managing your working capital, especially your accounts receivable.
How Can I Improve My Operating Cash Flow?
Improving your operating cash flow is all about making your core business better at generating and holding onto cash. This makes your company stronger and less dependent on loans or investors to stay afloat.
Here are four powerful ways to get started:
Get Paid Faster: Don't let invoices get old. Tighten up your payment terms, set up automated reminders for overdue accounts, or try offering a small discount (like 2%) for clients who pay within 10 days.
Bill More Often: Instead of sending one big bill at the very end of a project, switch to bi-weekly or milestone-based invoicing. This creates a much more consistent and predictable flow of cash into the business.
Manage Your Own Bills Strategically: Look at the payment terms you have with your vendors. Can you negotiate for Net 45 or even Net 60 terms? This lets you hold onto your cash a little longer without hurting those important supplier relationships.
Cut Unnecessary Operating Costs: Go through your recurring expenses with a fine-tooth comb. Are there software subscriptions you forgot about or other "phantom" costs bleeding you dry? Every dollar you save here goes straight back into your cash balance.
Does My QuickBooks Cash Flow Statement Rely on My Chart of Accounts?
Yes, 100%. The accuracy of your cash flow statement is completely dependent on a clean, well-organized Chart of Accounts and making sure every single transaction is categorized correctly. Your accounting software is smart, but it's not a mind reader—it can only work with the information you give it.
For instance, when you make a loan payment, that single payment has two different parts: interest and principal. The interest payment belongs in the operating section, but paying down the principal is a financing activity. If you just categorize the whole thing as one "Loan Payment" expense, both your operating and financing cash flow numbers will be wrong.
A messy Chart of Accounts will always give you a messy and useless cash flow statement. It's the blueprint for all your financial reports.
Feeling overwhelmed by your Chart of Accounts or unsure if your financial reports are accurate? The team at Steingard Financial specializes in cleaning up books, optimizing your accounting system, and delivering the clear, reliable reports you need to make confident decisions. Learn how we can give you true financial visibility.