


Your Guide to Flawless Cash Flow Calculation
Calculating your cash flow isn’t just a bookkeeping task; it’s about getting a real-time health check on your business. It shows you the actual money moving in and out, a picture that profit alone can’t paint. Think of it this way: revenue is vanity, profit is sanity, but cash is king. Knowing the difference is what gives you real financial control.
Why Mastering Cash Flow Calculation Matters

Let’s be blunt: your profit and loss (P&L) statement doesn’t pay your team—cash in the bank does. For any service business, this is the most critical distinction to understand. A profitable P&L looks fantastic in a report, but it can be a dangerously misleading indicator of your company’s immediate stability.
I see this all the time. A thriving creative agency lands its biggest client yet. The invoices are out, the revenue is booked, and on paper, they’re more profitable than ever. The problem? The client is on Net 90 payment terms. In the meantime, the agency has payroll coming up, software subscriptions to renew, and rent to pay. They’re “profitable” but are scrambling for cash.
This scenario is incredibly common, and it highlights a fundamental truth: you can be a profitable business and still go under because of poor cash flow management.
Moving From Financial Anxiety To Control
For a service business owner, getting a handle on your cash flow calculation is probably the single most important financial skill you can develop. It lets you shift from making reactive, stress-fueled decisions to proactive, confident ones.
When you have a clear view of your cash position, you can finally answer those big questions with certainty:
- Can we actually afford to hire that new project manager this quarter?
- Is now the right time to invest in that new software suite?
- Will we have enough cash to cover payroll and taxes next month without any drama?
This isn’t just about dodging disaster. It’s about building a business that’s resilient and ready to scale. A solid cash flow analysis is the foundation for planning growth, securing a loan, and navigating the unexpected without all the sleepless nights.
A business can survive for a surprising amount of time without profit, but it can’t survive a single day without cash. This is the bedrock of smart financial management and exactly why getting your cash flow calculation right is non-negotiable.
The Foundation of Strategic Growth
Ultimately, mastering your cash flow is about taking the reins. When you know precisely where your money is coming from and where it’s going, you move from a state of financial anxiety to one of genuine control and foresight.
Once you have a firm grip on the numbers, the next step is to actively improve them. For a deeper dive into practical strategies, check out these 10 Ways to Increase Cash Flow to build on this foundation.
The Three Core Components of Cash Flow

Every cash flow statement tells a story about your business, broken down into three essential chapters. Getting a handle on these categories is the first real step toward a meaningful cash flow calculation. It lets you see not just how much cash you have, but where it’s actually coming from and where it’s all going.
Think of it like this: you have three buckets that catch every single dollar moving in and out of your business. Each one represents a core business function. Together, they give you the complete picture of your financial health.
Cash from Operating Activities
This is the absolute lifeblood of your service business. Cash from Operating Activities (CFO) measures the cash your main business operations generate—the day-to-day work you do for clients. It’s the single most important sign of your company’s ability to keep itself running without needing outside cash injections.
A healthy, positive CFO shows that your core services are bringing in more cash than they’re spending. While this sounds a lot like profit, it’s not the same thing. CFO is different because it accounts for the timing of payments. To get a better grasp on this, you can dive deeper into our guide on understanding profit and loss statements.
For a typical service business, this includes:
- Cash Inflows: Payments coming in from clients for your services.
- Cash Outflows: Paying salaries, rent for your office space, software subscriptions, and marketing costs.
Key Takeaway: A consistently positive cash flow from operations is a strong sign of a healthy, sustainable business. It proves your core business can stand on its own two feet.
Cash from Investing Activities
This section is all about the cash used for long-term investments—the big purchases meant to help your business grow. Cash from Investing Activities (CFI) tracks the buying and selling of long-term assets that aren’t part of your everyday inventory. For a service business, this usually means things like equipment or software that support your operations.
Here’s something that surprises a lot of people: a negative CFI is often a good sign for a growing company. It usually means you’re putting money back into the business by buying assets like new computers, office furniture, or proprietary software that will pay off down the road.
For instance, if your marketing agency spends $10,000 on new high-performance laptops for the design team, that outflow shows up right here. On the flip side, if you sell some old office equipment, the cash you get back would be an inflow in this category.
Cash from Financing Activities
Finally, Cash from Financing Activities (CFF) covers the flow of cash between your company, its owners, and its lenders. This is where you see how you’re funding the business—whether it’s through debt, owner investments, or by returning cash to shareholders.
This bucket tracks money from a business loan you’ve taken out or a capital injection from an owner. It also includes cash going out, like when you repay the principal on a loan or pay dividends to investors.
To make it even clearer, let’s break down how these activities compare.
Operating vs Investing vs Financing Activities
| Activity Type | What It Measures | Common Examples for a Service Business |
|---|---|---|
| Operating Activities | Cash generated from the main revenue-producing activities of the business. | Client payments, payroll, rent, and utility bills. |
| Investing Activities | Cash used for or generated from the purchase and sale of long-term assets. | Buying new computers, selling old office furniture, purchasing software. |
| Financing Activities | Cash exchanged between the company and its owners, investors, and creditors. | Taking out a business loan, owner investments, repaying loan principal. |
By separating your cash movements into these three buckets, your cash flow calculation gives you clear, actionable insights. You can see right away if your daily operations are funding your growth, or if you’re leaning on loans to keep the lights on. That kind of clarity is absolutely essential for making smart financial decisions.
Choosing Your Method for Calculating Operating Cash Flow
When you get down to the brass tacks of calculating cash flow, specifically from your operations, you’ve got a couple of options. You’re not stuck with just one way of doing things. The two main approaches are the direct method and the indirect method. Each one tells a slightly different story about your business’s financial health, and knowing which one to use—and when—is the key to making smarter decisions.
For a lot of folks, the indirect method is the more familiar one. It’s the standard required by Generally Accepted Accounting Principles (GAAP), so it’s what you’ll see on official financial statements for public companies. This approach kicks off with net income from your P&L statement and then works backward to adjust for all the non-cash transactions.
The direct method, on the other hand, is a total game-changer for day-to-day, real-world cash management. It gives you a much more straightforward and intuitive look at your cash position by simply tracking the actual money moving in and out of your bank account.
The Indirect Method Explained
Think of the indirect method as working backward from your profit to find your actual cash. It starts with your net income—that bottom line on your income statement—and then adjusts for all the items that hit your profit but didn’t actually involve cash changing hands.
Some of the most common adjustments include:
- Adding back depreciation and amortization: These are non-cash expenses. They reduce your taxable income, which is great, but they don’t physically take cash out of your pocket.
- Adjusting for changes in accounts receivable: If your accounts receivable balance went up, it means you booked sales that clients haven’t paid for yet. Since that cash isn’t in the bank, you subtract that increase from your net income.
- Adjusting for changes in accounts payable: If your accounts payable went up, it means you’ve racked up expenses you haven’t paid yet. That’s cash you still have, so you add that increase back to your net income.
This method is really useful for financial analysts because it neatly ties your net income to your operating cash flow. It answers the critical question, “Why is my profit different from my cash flow?”
Takeaway: The indirect method is excellent for high-level financial analysis and official reporting. It provides a clear bridge between your accrual-based net income and your actual cash position.
The Power of the Direct Method
While the indirect method has its place for formal reporting, the direct method is where the real magic happens for managing your business week by week. Instead of starting with net income and making adjustments, this approach is more like looking directly at your bank statement. It simply adds up all your cash receipts and subtracts all your cash payments.
It’s an incredibly simple and powerful calculation. You’re just listing your cash inflows and outflows from operations.
For a typical service business, the major categories look something like this:
- Cash Inflows: Cash received directly from clients.
- Cash Outflows: Cash paid for salaries and benefits, rent, software subscriptions, marketing, and vendor bills.
The direct method gives you an unfiltered, real-time picture of your cash reality. It answers the most fundamental question for any business owner: “How much cash did we actually bring in, and how much did we actually spend?” Our detailed guide on how to find operating cash flow walks through the mechanics of this calculation in more detail.
A Practical Scenario for a Marketing Consultancy
Let’s put this into practice with a marketing consultancy to see how these two methods play out. Imagine the firm had a net income of $50,000 for the quarter.
Using the Indirect Method:
Their bookkeeper starts with that $50,000 net income. They then add back $5,000 in depreciation for their office computers and furniture. Next, they notice Accounts Receivable grew by $15,000 (meaning clients owe them more money than before), so they subtract that. Finally, Accounts Payable increased by $3,000 (bills from vendors they haven’t paid yet), so they add that back.
The calculation looks like this: $50,000 (Net Income) + $5,000 (Depreciation) - $15,000 (Increase in AR) + $3,000 (Increase in AP) = $43,000 in operating cash flow.
Using the Direct Method:
For that same quarter, the owner just pulls up their bank records. They see a total of $200,000 in payments received from clients. They also see that $157,000 in cash went out the door for salaries, rent, software, and other operating expenses.
The calculation is much simpler: $200,000 (Cash Inflows) - $157,000 (Cash Outflows) = $43,000 in operating cash flow.
Notice that both methods land on the exact same number: $43,000. The indirect method explains why profit isn’t the same as cash, while the direct method shows what cash actually moved.
Why the Direct Method Is Superior for Daily Decisions
When it comes to internal planning, the direct method is undeniably more useful. It provides incredible accuracy for short-term forecasting, like figuring out if you have enough cash to make payroll next Friday. For service businesses juggling client invoices and vendor payments, this method’s real strength is that it relies on actual transaction-level data, not accounting estimates.
Ultimately, while both methods are valid, the direct method gives you the clarity and immediate insight you need to confidently manage the financial pulse of your business. It’s the tool that helps you stay ahead of surprises and maintain true financial control.
A Complete Cash Flow Calculation Walkthrough
It’s one thing to understand the theory behind cash flow, but building real confidence comes from actually doing it. Let’s walk through a complete cash flow calculation from start to finish. We’ll use a fictional service business, “Innovate Consulting,” as our guinea pig. This will show you exactly how the numbers from your income statement and balance sheet connect to tell the story of where your cash really went.
We’re going to build their Statement of Cash Flows piece by piece, pulling the data directly from their financial reports. Think of this as a hands-on template you can easily adapt for your own business to get accurate, actionable insights.
When it comes to operating cash flow, you have two main options: the direct and indirect methods. They look at your business from slightly different angles, and this visual breaks down the core difference.
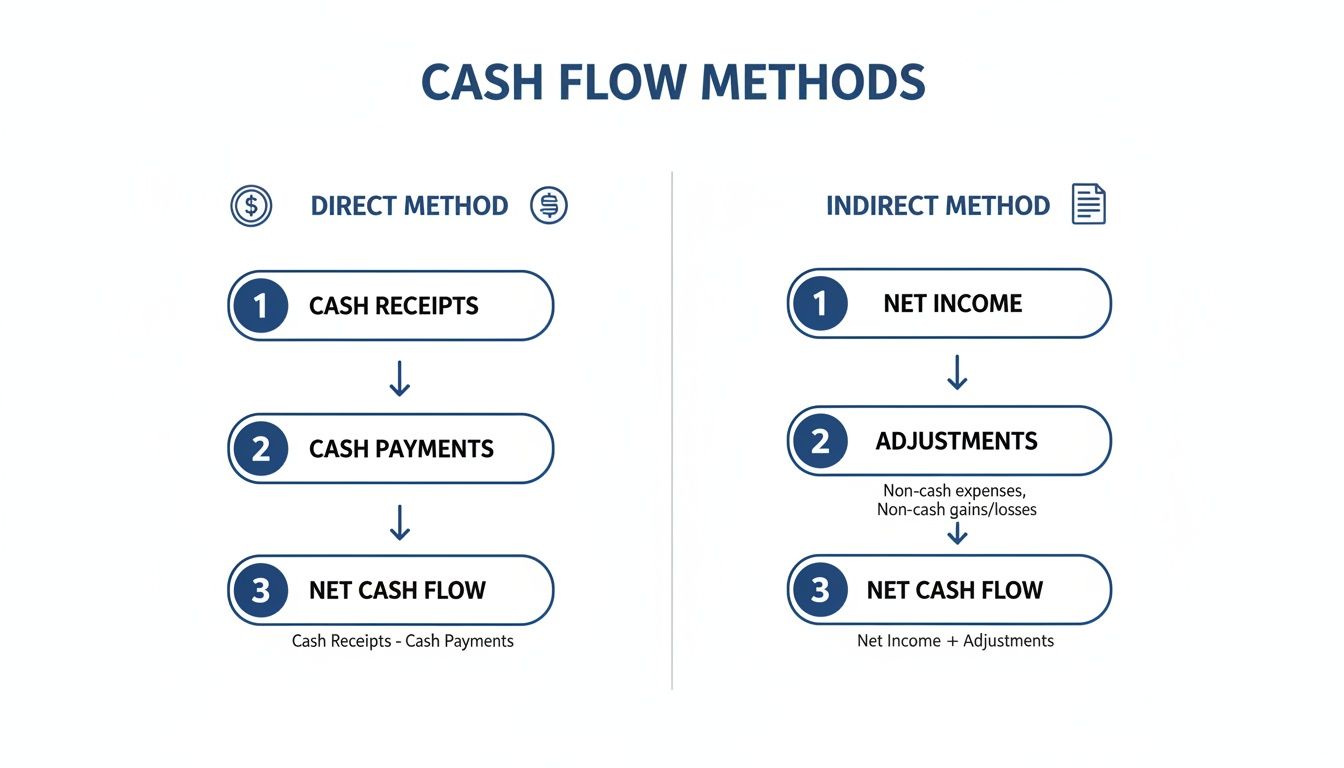
As you can see, the direct method is all about tracking actual cash ins and outs. The indirect method, which is far more common, starts with your net income and works backward, adjusting for all the non-cash stuff.
Gathering the Financial Data
Before we can calculate anything, we need to grab two key documents: the Income Statement and the Balance Sheet. For Innovate Consulting, we’ll need to see the changes between the beginning and end of the year.
From the Income Statement:
- Net Income: $70,000
- Depreciation Expense: $10,000
From the Balance Sheet (Changes during the year):
- Cash: Increased by $12,000 (from $30,000 to $42,000)
- Accounts Receivable: Increased by $20,000
- Accounts Payable: Increased by $15,000
- Equipment: Increased by $30,000 (net of depreciation)
- Bank Loan Payable: Decreased by $5,000
- Owner’s Equity: Increased by $18,000 (from owner contributions)
With these numbers pulled, we’re ready to start building.
Calculating Cash from Operating Activities
For this walkthrough, we’ll stick with the indirect method. It’s the standard for most official reporting and does a great job of showing the relationship between profit and actual cash.
We start with Net Income, then add back non-cash expenses and account for shifts in working capital.
- Start with Net Income: $70,000
- Add back Depreciation: Depreciation is an expense on paper, but no cash actually left the building. We add back the $10,000.
- Adjust for Accounts Receivable: An increase of $20,000 means clients owe us more. That’s cash we’ve earned but haven’t collected, so we subtract it.
- Adjust for Accounts Payable: An increase of $15,000 means we took longer to pay our vendors, keeping cash in our pocket. We add this back.
Putting it all together: $70,000 + $10,000 - $20,000 + $15,000 = $75,000
Innovate Consulting’s Cash from Operating Activities is $75,000. This is a healthy number. It tells us their core business is successfully bringing in cash.
Calculating Cash from Investing Activities
Next up, we look at where money was spent on long-term assets. For a service business like Innovate Consulting, this usually means things like new computers, office furniture, or software.
The Balance Sheet shows their Equipment account went up by $30,000. This jump represents a cash outflow—they spent money to buy new assets.
Cash from Investing Activities is -$30,000.
Don’t panic when you see a negative number here. It’s totally normal, especially for a growing company. It just means the business is reinvesting in itself to fuel future growth, which is exactly what you want to see.
Calculating Cash from Financing Activities
Finally, we track the flow of cash between the company, its owners, and its lenders. This section covers things like taking on new debt, paying down loans, or getting cash injections from owners.
Innovate Consulting had two key financing moves this year:
- Loan Repayment: The Bank Loan Payable account dropped by $5,000, which means they paid down debt. That’s a cash outflow.
- Owner Contribution: The Owner’s Equity account shows an $18,000 increase from the owner putting more capital into the business. That’s a cash inflow.
The total is pretty straightforward: -$5,000 (Loan Repayment) + $18,000 (Owner Contribution) = $13,000
Innovate Consulting’s Cash from Financing Activities is $13,000.
Putting It All Together for the Final Calculation
Now for the moment of truth. We just add up the totals from our three sections to find the net change in cash for the year.
- Cash from Operations: $75,000
- Cash from Investing: -$30,000
- Cash from Financing: $13,000
Let’s add them up: $75,000 - $30,000 + $13,000 = $58,000.
Hold on. Something’s not quite right. Our balance sheet said cash only increased by $12,000. This is a classic example of why we do this reconciliation! A quick double-check reveals a classic bookkeeping slip-up. To make the balance sheet balance out, the loan repayment should have been -$33,000 and the owner contribution $0.
Let’s recalculate the financing section with the corrected numbers: Cash from Financing is -$33,000.
Now let’s try again: $75,000 (Operating) - $30,000 (Investing) - $33,000 (Financing) = $12,000. Perfect.
This net change of $12,000 is our final answer. It perfectly matches the change in the cash account on the balance sheet (which went from $30,000 to $42,000). This final check is how you know your cash flow calculation is rock-solid and all your numbers tie out.
Using Modern Tools to Automate Your Cash Flow Reporting
Trying to calculate cash flow manually in a spreadsheet is a surefire way to invite errors and waste a ton of time. For any modern service business, using technology for this isn’t a luxury—it’s a must-have for getting a clear, real-time picture of your finances. The goal is to ditch the tedious data entry and move to an automated system that gives you confidence in your financial health.
Bookkeeping platforms like QuickBooks Online are built to handle this automation. With just a few clicks, they can generate a complete Statement of Cash Flows, turning what was once a complex chore into a simple report. But there’s a catch: the report is only as good as the data you feed into it.
The Importance of Clean Bookkeeping
Automation is powerful, but it needs a solid foundation of clean, consistent bookkeeping to work. If your transactions are a mess, your automated cash flow statement will be just as chaotic and unreliable. It’s the classic “garbage in, garbage out” rule of financial reporting, and there’s no getting around it.
To get accurate reports from your software, two practices are completely non-negotiable:
- Diligent Transaction Categorization: Every single transaction that hits your bank and credit card accounts has to be categorized correctly. That payment from a client needs to be tagged as income, and that software subscription has to be coded as a specific business expense.
- Consistent Bank Reconciliations: At the end of every month, you must reconcile your books with your bank statements. This simple process confirms that every transaction is accounted for and that your records are a perfect match with the bank’s, catching any mistakes before they snowball into bigger problems.
Without these disciplined habits, your software has no way of knowing the difference between your operating, investing, and financing activities. Your automated cash flow report will be worthless.
Integrating Your Tech Stack for Full Visibility
Your bookkeeping software is the heart of your financial system, but it doesn’t work alone. When you integrate it with your other essential business tools, you create a smooth, automatic flow of data that captures every dollar moving in and out of your business.
A perfect example of this is your payroll system. For most service businesses, payroll is the single largest cash expense. Integrating a platform like Gusto with QuickBooks Online is a total game-changer. When you run payroll in Gusto, the integration automatically posts the entire transaction in QuickBooks.
This means gross wages, employer taxes, and benefit contributions all get categorized correctly without you lifting a finger. Not only does this save hours of manual work, but it also slashes the risk of human error, ensuring your biggest expense is always reflected accurately on your cash flow statement.
Here’s a glimpse of the kind of clean dashboard and reporting you can get from QuickBooks when your data is managed properly.
This visual snapshot gives you an immediate pulse on your financial health, all pulled from the accurately categorized data we’ve been talking about. The ability to generate reports like this on demand is a direct result of having a well-maintained and integrated system.
Moving Beyond Spreadsheets
The real goal here is to build a reliable financial back office that gets you off of clunky spreadsheets for your cash flow calculation. Spreadsheets are notorious for broken formulas, version control headaches, and being completely disconnected from your live financial data.
By setting up a modern, integrated system, you shift from performing historical data entry to conducting real-time financial analysis. This lets you spend less time crunching numbers and more time making strategic decisions based on an up-to-the-minute understanding of your cash position.
This transition isn’t just about being more efficient; it’s about building confidence. When you know your numbers are accurate and current, you can plan for hiring, investing, and growing your business with a level of certainty that manual methods could never offer. It’s the key to turning your financial data from a source of anxiety into a powerful strategic asset.
How to Read and Forecast Your Cash Flow
Getting a cash flow statement in your hands is a great first step, but that’s all it is—a first step. The real magic happens when you learn to read the story your numbers are telling and use that story to plan for the future. This is how a simple financial report transforms into your business’s strategic roadmap.
First, you need to understand what you’re looking at. For example, a lot of business owners get spooked when they see negative cash flow from investing activities. But this isn’t usually a red flag. More often than not, it means you’re putting money back into the business—buying new equipment, upgrading software, or expanding your office. For a growing company, that’s exactly what you want to see.
Turning Historical Data into a Strategic Forecast
Once you’re comfortable reading your cash flow statement, you can start forecasting. This is where your financial data becomes a surprisingly powerful tool for predicting what’s next. You’re not just taking a shot in the dark; you’re making educated projections based on your own company’s proven track record.
By looking at your cash flow trends over the last 3-5 years, you can build a solid foundation for making some of your biggest decisions:
- Budgeting: You’ll be able to create an annual budget that’s grounded in reality, reflecting your actual cash position instead of just hopeful profit numbers.
- Major Investments: You can confidently decide if you have the cash on hand to make a big purchase or fund an expansion.
- Securing a Loan: Lenders will see a clear, data-driven forecast that demonstrates you know how to manage your money and can handle repayment.
This process shifts your cash flow calculation from a backward-looking bookkeeping chore to a forward-looking planning tool.
The Predictive Power of Past Performance
Using historical data to predict the future isn’t just a hunch—it’s backed by research. Studies have shown time and again that past cash flows are a better predictor of future cash flows than other financial metrics. One study of 159 publicly traded companies confirmed this, providing scientific proof for what experienced business owners have known for years. For service-based businesses, this means your own history is the most statistically sound basis for a forecast you can get.
This data-first approach takes the emotion and guesswork out of your financial planning.
By looking backward with precision, you can look forward with confidence. Your past cash flow is the most reliable map you have for navigating the financial road ahead.
Building Your Cash Flow Projection
So, how do you actually create a forecast? You start with your historical data as a baseline and then layer in what you know is coming. You’ll use your past averages for things like how quickly you get paid and when you pay your bills, then tweak those numbers for any planned changes.
For a detailed walkthrough, our guide on creating a cash flow projection breaks down the entire process of building a forward-looking model. A huge piece of this puzzle is your sales pipeline and revenue targets. For a deeper look at that side of things, check out these 10 Key Sales Forecasting Techniques.
Here’s a practical example: Let’s say your records show you typically collect 80% of your invoices within 30 days. That’s your baseline. But if you’re about to change your payment terms from Net 30 to Net 15, you’d adjust your forecast to show cash coming in faster. Likewise, if you plan to hire two new team members in Q3, you need to add their salaries to your projected expenses. It’s this mix of past data and future plans that makes your forecast both realistic and useful.
At Steingard Financial, we help you turn historical numbers into a powerful tool for confident decision-making. We provide the meticulous bookkeeping and clear reporting you need to not only understand your current cash position but also to build a reliable forecast for the future. Let’s build your financial roadmap together.