P&L management is the active process of using your Profit and Loss statement to make strategic business decisions. It’s not just about recording what happened in the past; it’s about analyzing your revenue, costs, and profits to steer your company toward its financial goals.
What Is P&L Management Really About?
Think of your business as a ship navigating the open sea. Your Profit & Loss (P&L) statement is your navigation chart, showing where you’ve been and plotting your course ahead. P&L management is the art of being the ship’s captain—actively using that chart to make decisions that keep you on course and headed for your destination.
It’s the difference between passive bookkeeping and proactive financial strategy. Instead of just noting that profits were down last quarter, you dig deeper to find out why. Was it a slump in sales for a key service? An unexpected jump in contractor costs? This active analysis is the heart of P&L management.
The Three Pillars of Your Financial Story
Your P&L tells a story through three main characters: revenue, costs, and profit. Managing them effectively means understanding how they all work together.
- Revenue: This is the wind in your sails. It’s all the income your business generates from its services. Good management means knowing which revenue streams are strongest and figuring out how to grow them.
- Costs: These are the anchors dragging you down. They include every single expense needed to run your business, from payroll and software subscriptions to rent and marketing.
- Profit: This is how you measure progress toward your destination—the ultimate sign of success. It’s what’s left after you subtract all your costs from your revenue.
This simple diagram shows how these three core elements build the structure of your P&L statement.
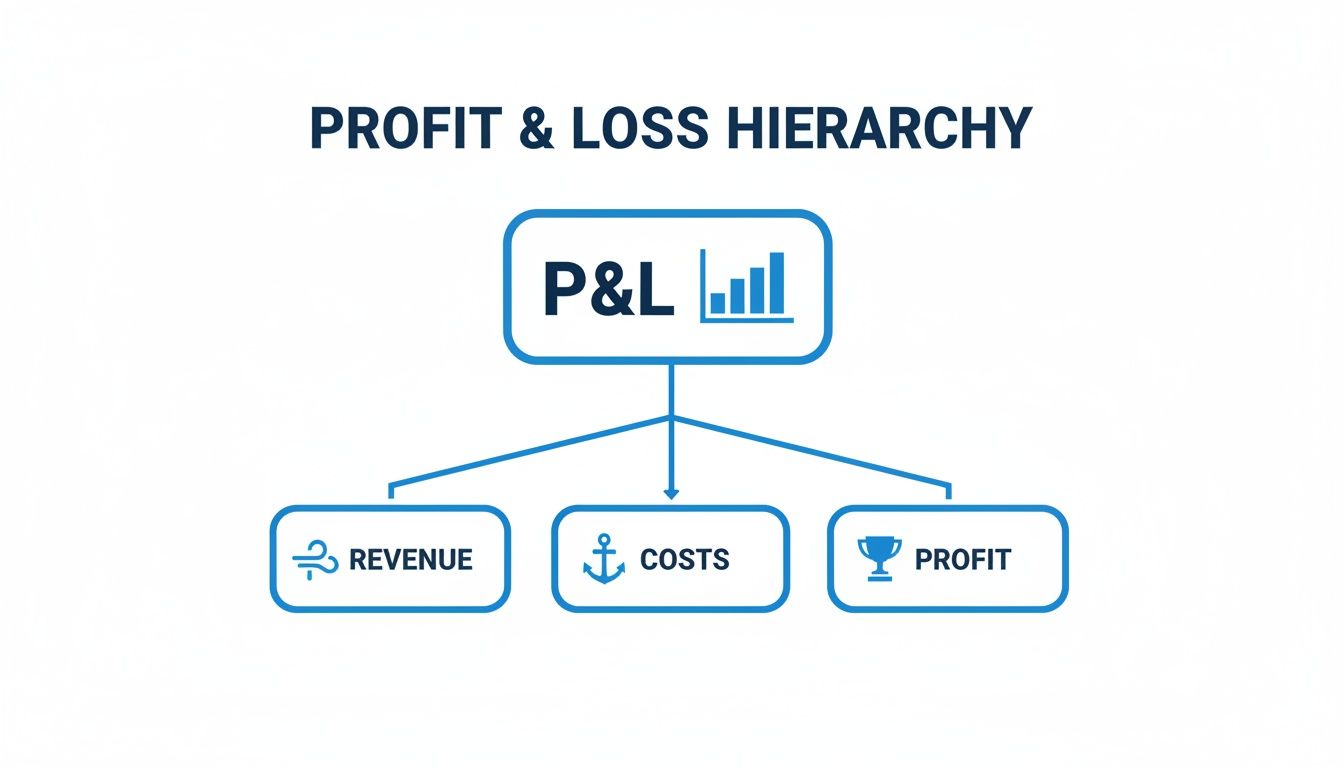
As you can see, profit is the direct result of balancing the upward push of revenue against the downward pull of costs.
To help you get comfortable with these terms, here’s a quick-reference chart that breaks down the essentials.
Your P&L Navigation Chart at a Glance
A quick summary of the essential elements on a Profit and Loss statement and what they reveal about your business’s financial journey.
| Component | What It Represents | Example for a Service Business |
|---|---|---|
| Revenue | The total income generated from selling your services before any expenses are deducted. It’s your top line. | A marketing agency bills $50,000 in a month for client projects. |
| Costs | All expenses incurred to operate the business, broken down into direct costs (COGS) and indirect costs (Operating Expenses). | Monthly payroll of $20,000, software subscriptions of $1,500, and office rent of $3,500. |
| Profit | The final bottom line after all costs are subtracted from revenue. This is what you actually earned. | $50,000 (Revenue) – $25,000 (Total Costs) = $25,000 in profit. |
This table provides a snapshot, but the real power comes from digging into the details behind each number.
P&L management is less about accounting and more about strategy. It transforms your financial statement from a historical document into a forward-looking roadmap for intelligent, sustainable growth.
Ultimately, mastering your P&L means you stop reacting to financial outcomes and start creating them. You learn to adjust the sails (pricing and sales), streamline the hull (cost control), and steer confidently through market storms. It’s about being in complete control of your financial journey and ensuring you not only stay afloat but reach your profitability goals.
How to Read Your P&L Statement
Trying to read a Profit and Loss (P&L) statement for the first time can feel like you’ve been handed a map in a foreign language. But once you learn to spot the key landmarks, you’ll see it tells a clear and powerful story about your business’s financial journey.
Think of it as a story that starts at the very top and works its way down to the famous ‘bottom line’.

To make this real, we’ll walk through the P&L of a hypothetical digital marketing agency.
The Top Line Revenue
Every P&L story kicks off with Revenue, often called the “top line.” This number is simple: it’s the total amount of money your business brought in from its services during a set period, before a single expense has been touched.
For a service business like our marketing agency, this isn’t just one lump sum. It’s usually a mix of different income streams.
- Project Fees: Think one-time payments for specific jobs, like building a new website.
- Monthly Retainers: This is the recurring income from ongoing work, like managing a client’s social media accounts.
- Hourly Billing: Charges for time spent on specialized consulting or other tasks.
Add all those up, and you get the agency’s total revenue. Let’s say for the month, that number is $100,000. This figure sets the stage for everything that follows.
Uncovering Direct Costs and Gross Profit
The next chapter in our P&L story is subtracting the direct costs of delivering your services. In the service world, we call this the Cost of Services (CoS) or Cost of Revenue. It’s our version of the “Cost of Goods Sold” (COGS) that product businesses use.
These are the expenses directly tied to generating revenue.
Key Takeaway: The Cost of Services includes only the expenses that you wouldn’t have if you didn’t have a specific client or project. If the cost exists whether you have one client or one hundred, it’s not a direct cost.
For our agency, direct costs would include things like:
- Payments to freelance writers for a specific client’s blog posts.
- The cost of a software license used exclusively for one large project.
- Ad spend that you manage and pass through for a client.
If these direct costs add up to $30,000, we subtract that from our revenue: $100,000 – $30,000 = $70,000. That $70,000 is your Gross Profit, a critical number that shows you how profitably you deliver your core services.
Operating Expenses and the Bottom Line
After finding your Gross Profit, it’s time to account for Operating Expenses (OpEx). These are all the indirect costs needed to keep the lights on, regardless of how many clients you’re serving. We’re talking about staff salaries, office rent, marketing software, and insurance.
Getting these categories right is crucial, which is why having a well-organized financial system from day one is so important. A thoughtfully designed system ensures every dollar is coded correctly. You can get a deeper understanding of this by learning why your chart of accounts matters.
Let’s say the agency’s OpEx for the month is $40,000. We subtract that from our Gross Profit: $70,000 – $40,000 = $30,000. This result is the Operating Profit, which tells you how much money the business’s core operations are making.
Finally, we reach the end of the story: the Net Profit, or the “bottom line.” This is what’s left after accounting for any non-operating items like interest payments and taxes. If those come to $5,000, the final Net Profit is $25,000. This is the ultimate measure of what your business truly earned.
Why P&L Management Is a Game Changer
For a service business, solid P&L management isn’t just a good financial habit—it’s a massive competitive advantage. Unlike companies that sell physical products, your most valuable assets are your people, their time, and their expertise. This means your profitability hinges on things that are much harder to track than inventory, making a deep understanding of your P&L statement absolutely critical.
Active P&L management is what separates businesses that are truly thriving from those just getting by. It’s the difference between guessing which clients are profitable and knowing for sure. It helps you decide with confidence when to hire your next team member or how to price a new service to guarantee healthy margins.

Without this discipline, you’re flying blind and making crucial decisions based on gut feelings or incomplete information. With it, you shift from constantly putting out fires to building a proactive, data-driven strategy for growth.
Turning Data into Decisive Action
The real magic of P&L management is its ability to tell you the story behind your numbers, allowing you to pull the right levers to drive your business forward. It gives you clear, no-nonsense answers to your most pressing questions.
For example, by analyzing your revenue and cost of services, you can pinpoint exactly which types of projects or clients deliver the highest profit margins. That insight alone is huge—it tells you where to focus your sales and marketing efforts for the biggest impact.
This strategic focus has been a cornerstone of successful businesses for decades. Research going all the way back to 1975 showed a direct link between market share and profitability. The study found that businesses with a dominant market share (over 50%) hit an average pretax ROI of 27%, while those with less than 10% share often struggled, posting average pretax losses. You can read more on how market position impacts financial performance in the full research on profitability drivers.
From Reactive to Proactive Leadership
Ultimately, consistent P&L management makes you a much more effective leader. Instead of reacting to cash flow shortages or wondering why profits are down, you can see challenges coming and jump on opportunities before they fully emerge.
Key Takeaway: P&L management transforms your financial statements from a rearview mirror into a GPS for your business. It doesn’t just show you where you’ve been; it helps you navigate where you’re going.
This proactive approach allows you to:
- Optimize Pricing: Confidently set rates that cover all your costs and lock in a healthy profit.
- Control Costs Strategically: See where you can cut expenses without hurting the quality of your services or your team’s morale.
- Scale Intelligently: Make hiring and investment decisions backed by solid financial data, not just ambition.
By embracing this process, you gain true financial control. You stop being a spectator watching your business’s financial performance and become the architect of its success, ensuring sustainable growth and long-term profitability in a competitive world.
Tracking the Right P&L Metrics and KPIs
Just looking at your net profit is a bit like only checking the final score of a football game. Sure, you know who won, but you miss all the brilliant plays, costly fumbles, and game-changing strategies that actually decided the outcome. To really understand how your business is performing, you need to dig into the Key Performance Indicators (KPIs) that tell the whole story.
These metrics, which you can pull right from your P&L statement, turn raw numbers into real intelligence. Think of them as your company’s financial vital signs—they give you a constant pulse on your operational efficiency, pricing strategy, and overall business health.
The Three Essential Profit Margins
The most powerful KPIs for P&L management are your profit margins. Each one reveals a different, absolutely critical piece of your business’s financial puzzle.
- Gross Profit Margin: This number shows you how profitable your core services are, plain and simple. You calculate it as (Gross Profit / Revenue) x 100. It tells you how much profit you’re making from each dollar of revenue before you even think about overhead. A high margin here means your pricing is strong and you’re delivering your services efficiently.
- Operating Profit Margin: This metric moves a step further to show how well you manage the entire business. Calculated as (Operating Profit / Revenue) x 100, it measures how profitable your core operations are after paying for all your operating expenses. A healthy operating margin is a great sign that you have your overhead costs firmly under control.
- Net Profit Margin: This is the ultimate bottom line. You find it by calculating (Net Profit / Revenue) x 100, and it shows the percentage of revenue left after every single expense—including taxes and interest—has been paid. It’s the clearest indicator of your company’s overall financial health.
By tracking all three margins, you can pinpoint exactly where your business is excelling and where it might be leaking profit. For example, a high Gross Profit Margin but a low Net Profit Margin is a clear signal that your overhead expenses are too high.
Putting Your Numbers into Context
Knowing your percentages is only half the battle. The other half is knowing what “good” actually looks like for a business like yours. Profitability benchmarks can vary wildly from one industry to the next, which makes having some context essential for smart P&L management.
For instance, the banking industry often sees net profit margins around 30%, while a capital-heavy sector like auto manufacturing might struggle with negative net margins. This table gives a better sense of how different industries stack up.
A Cross-Industry Comparison of Profit Margins
| Industry | Average Gross Profit Margin (%) | Average Net Profit Margin (%) |
|---|---|---|
| Software & Tech Services | 70-90% | 15-25% |
| Professional Services (Consulting, Legal) | 35-50% | 10-20% |
| Retail (General) | 25-40% | 2-5% |
| Restaurants | 60-70% | 3-6% |
| Construction | 15-25% | 2-4% |
As you can see, a 5% net margin might be a reason to celebrate in retail but a major red flag in the software world. These differences are exactly why comparing your performance against industry averages is so vital for spotting opportunities and weaknesses. You can find more detailed industry comparisons in this analysis of average profit margins.
Beyond just margins, good P&L management means you’re also tracking trends in your revenue and expense lines from month to month. Are your software costs slowly creeping up? Is one particular service line showing incredible growth? Answering these questions helps you catch opportunities and threats before they become big problems.
This kind of analysis is also a critical input for accurate financial forecasting, a topic we explore in our guide to creating a reliable cash flow projection.
Building Your Monthly P&L Management Routine
True P&L management isn’t a one-time task you check off a list. It’s a discipline. Think of it as a repeatable monthly habit that transforms your financial data from a simple record of the past into a powerful tool for shaping your future. This routine is the key to staying in control and making smart, informed decisions, month after month.

This process is built on a few core, non-negotiable activities that create a reliable workflow.
H3: 1. Consistent, Up-to-Date Bookkeeping
You can’t build a strong house on a shaky foundation, and you can’t manage your P&L with messy books. Accurate data is the absolute bedrock of this entire process.
This means having a solid system for categorizing every single transaction as it happens. When bookkeeping becomes a daily or weekly habit instead of a panicked scramble at the end of the month, the numbers flowing into your P&L are far more reliable. If you need to shore up this area, our guide on bookkeeping basics for your small business is a great place to start.
H3: 2. Payroll and Labor Cost Allocation
For any service business, your people are both your greatest asset and your biggest expense. That’s why running payroll isn’t just about cutting checks—it’s a critical input for your P&L.
You have to properly allocate every dollar of your payroll, including taxes and benefits, to the right cost categories. Doing this correctly is the only way to get a true picture of your Cost of Goods Sold (COGS) and your operating expenses, which ultimately determines your gross and net profit margins.
H3: 3. The Month-End Close and Review
This is where everything comes together. The month-end close is a structured process to finalize your books, which includes reconciling accounts, making necessary adjustments, and then generating your official P&L statement. This isn’t just about closing the books; it’s about opening a conversation.
Making a real commitment to this process transforms your P&L from a chore into what should be your most valuable strategic meeting of the month.
During this review, you need to ask sharp questions that lead to real action:
- Which of our services delivered the best gross profit margins this month?
- Where did our operating expenses pop up compared to last month or what we budgeted?
- Are we discovering that certain clients or projects are less profitable than we assumed?
By committing to this structured monthly routine, you create a powerful feedback loop. The insights you gain from one month’s review directly inform your decisions for the next, ensuring you’re always steering your business with the clearest financial intelligence possible.
How Steingard Financial Can Master Your P&L
Knowing what a P&L statement is one thing, but actually using it to steer your business toward growth is a completely different ballgame. Many service business owners are juggling a dozen different roles. They just don’t have the time—or the specialized financial background—to dig into the numbers and pull out a clear plan of action.
This is exactly where an expert partner can change everything.
At Steingard Financial, we see P&L management as much more than just keeping the books clean. We build solid systems so your data is always right on the money. Then, we turn that data into reports that actually tell a story about where your business has been and where it’s headed. Our job is to translate the complex numbers into strategic advice you can run with.
A Partnership for Profitability
We help you connect the dots between the big picture and the small details. You’ll finally get clarity on which clients are your most profitable, which services are driving the most revenue, and where you can trim costs without sacrificing quality.
This level of financial control is the foundation of success, no matter what industry you’re in. Just look at the banking world, where sharp P&L management recently led to a record $1.2 trillion in global net income. They did it by finding every opportunity to maximize revenue while keeping a close eye on risk. You can learn more about how they did it in this full banking industry review.
Steingard Financial turns your P&L from a historical document into a forward-looking roadmap. We help you build a more profitable, scalable, and resilient business by making your numbers work for you.
Ready to get that kind of clarity for your business? Schedule a consultation today, and let’s get your P&L mastered.
Common Questions About P&L Management
As you start to get the hang of P&L management in theory, you’ll naturally have questions about how it all works in the real world. Here are a few of the most common ones we hear from business owners.
What Is the Difference Between a P&L and a Balance Sheet?
I like to use a simple analogy: think of it as a movie versus a snapshot.
Your Profit & Loss (P&L) statement is the movie. It shows you the story of your financial performance over a specific period—like a month, a quarter, or a year—by tracking all your revenue and expenses. At the end of the movie, you know if you made a profit.
The Balance Sheet, on the other hand, is a single snapshot. It freezes a specific moment in time and shows your financial position by listing everything you own (Assets) against everything you owe (Liabilities). Both are absolutely vital, but they tell you different things. You need both to get the full picture of your company’s financial health.
How Often Should I Review My P&L Statement?
You need to be looking at your P&L statement every single month, without fail. A monthly review is the perfect rhythm to spot important trends, catch small problems before they balloon into big ones, and make smart, timely adjustments based on what the numbers are telling you.
Waiting until the end of the quarter or, even worse, the end of the year, is almost always too late to course-correct effectively. For businesses in a high-growth phase or those navigating a shaky market, we even recommend a quick weekly check-in on key P&L metrics to stay nimble.
Can I Manage My P&L Myself or Do I Need an Expert?
In the early days, many small business owners can definitely handle basic P&L tracking themselves, especially with today’s accounting software. It’s a great way to learn the fundamentals of your business’s finances.
But as your business grows, so does its financial complexity. The risk of making a costly mistake goes up, and the time it takes to manage the books starts to pull you away from more important work.
Bringing in an experienced professional does more than just ensure your numbers are accurate. They can provide deeper strategic insights and help you transform your P&L from a historical record into a powerful tool for forecasting and making confident decisions. It frees you up to focus on running your business, not just tallying up the past.
Ready to turn your financial data into a clear action plan? The team at Steingard Financial goes beyond basic bookkeeping to provide the strategic guidance you need to build a more profitable and resilient business. Get in touch with us today.