


Master Your Chart of Accounts Setup for Services
You're probably in one of two places right now. You've opened QuickBooks Online, looked at the default chart of accounts, and thought, “I guess this is fine.” Or you've already started booking transactions and your reports technically exist, but they don't answer the questions you care about.
That's where most new service businesses get stuck.
A chart of accounts setup isn't just an accounting task you check off so taxes can happen later. It's the structure that determines whether your Profit & Loss statement helps you price work, hire well, and spot margin problems early, or whether it gives you a pile of generic categories that hide what's really going on.
For service businesses, that matters more than owners usually realize. Labor drives the business. If payroll, contractor spend, benefits, software tied to delivery, and client-facing costs all land in broad buckets, you can't see profitability clearly. You can collect revenue and still make bad staffing decisions because the books don't show where the cost sits.
Your Chart of Accounts Is a Strategic Tool Not Just a List
A bad chart of accounts setup creates familiar problems. You look at the P&L and see “Payroll Expenses,” “Software,” and “Sales.” That might satisfy a tax preparer, but it won't tell you whether retainer work is carrying the business, whether project work is underpriced, or whether your client service team is producing healthy margins.
That gap is bigger in service businesses because labor dominates the economics. For service businesses, 78% of revenue is tied to labor costs, and a 2025 McKinsey study found that 64% of firms misclassify labor-related expenses in their Chart of Accounts, which leads to flawed profitability analysis and poor staffing decisions.

What generic reports fail to show
Most default setups flatten the business into a few broad categories. That creates blind spots around:
- Service mix: You can't tell whether retainers, one-time projects, or advisory work produce the strongest margin.
- People costs: Employee wages, contractor spend, payroll taxes, and benefits often get mixed together.
- Operational decisions: Hiring looks affordable until you separate direct client labor from admin overhead.
- Client profitability: Revenue may be tracked by customer, but costs often aren't structured to support meaningful analysis.
A chart of accounts should help an owner answer management questions first, then support tax reporting. Not the other way around.
What a strategic COA looks like
A useful chart of accounts setup acts like a blueprint. It doesn't try to capture every possible detail inside the main account list. Instead, it creates the right structure so your bookkeeping software, payroll system, and reporting can work together.
For a service business, that usually means your accounts should reflect how the business runs:
- Revenue grouped by service type
- Direct labor separated from overhead labor
- Contractor costs separated from employee costs
- Payroll and benefits mapped in a way that supports role-based analysis
- Software split between client-facing tools and admin tools when that distinction matters
That's the difference between books that satisfy compliance and books that support decisions.
If your staffing model changes, your chart of accounts should help you see the impact. If you add a new service line, your chart of accounts should let you measure it. If your payroll system posts entries automatically, your chart of accounts should absorb that data cleanly instead of dumping it into generic expense buckets.
When owners say they “have QuickBooks but still don't know the numbers,” the chart of accounts is usually the first place I look.
Designing Your COA for Financial Clarity
A clean chart of accounts setup starts before you click “New account” in QuickBooks. You need a structure that mirrors your financial statements and still fits the way your service business earns and spends money.
The backbone is standard. The accounting industry uses a four-digit numbering convention that organizes accounts by type: Assets 1000 to 1999, Liabilities 2000 to 2999, Equity 3000 to 3999, Revenue 4000 to 4999, and Expenses 5000 to 9999. That framework mirrors the balance sheet and income statement, which is why it's still the most practical starting point for a new business, as explained in this overview of chart of accounts numbering and structure.
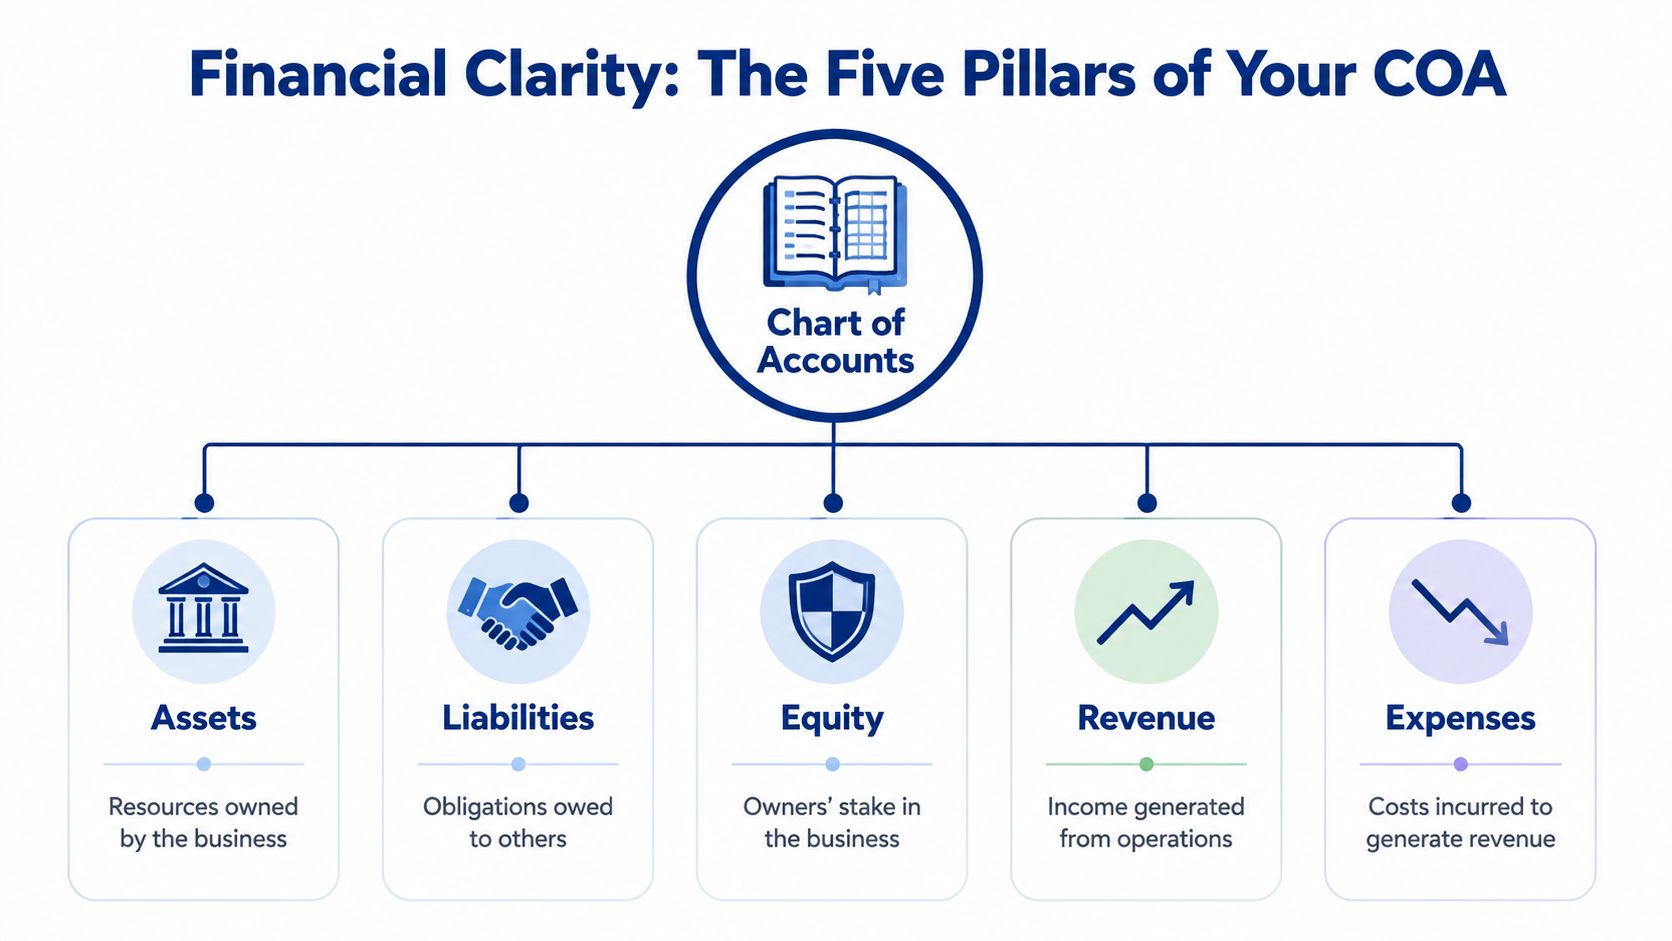
The five pillars that matter
Here's what those categories mean in plain language for a service business:
| Account type | What it holds | Service business examples |
|---|---|---|
| Assets | What the business owns or controls | Checking, savings, accounts receivable, prepaid software |
| Liabilities | What the business owes | Credit cards, payroll liabilities, loans, sales tax payable |
| Equity | Owner interest and retained earnings | Owner contribution, distributions, retained earnings |
| Revenue | Money earned from operations | Retainer revenue, project revenue, consulting revenue |
| Expenses | Costs of running and delivering services | Payroll, contractors, software, rent, marketing |
Build around how you earn revenue
Many setups frequently become either oversimplified or overcomplicated.
If all income goes into one “Service Revenue” account, your reports stay tidy but don't tell you much. If you create a separate revenue account for every client, your reports become noisy and hard to maintain. The better approach is to create revenue accounts by meaningful service line.
A practical example:
- 4010 Retainer Revenue
- 4020 Project Revenue
- 4030 Consulting Revenue
That gives you an immediate view of how the business is generating income without turning the chart into a client list. Client-level detail can live in your customer records, classes, or projects.
Design expense accounts around decision-making
Expenses deserve the same discipline. Broad accounts like “Payroll” or “Operating Expenses” usually hide the exact information owners need.
Try grouping expenses according to management use:
- Direct client delivery costs
- Sales and marketing costs
- General and administrative costs
- People-related costs broken out by type
That could look like:
- 5010 Salaries, Client Services
- 5020 Contractor Expense, Client Services
- 5030 Payroll Taxes
- 5040 Employee Benefits
- 5210 Marketing and Advertising
- 5310 Software, Client Facing
- 5320 Software, Admin
- 5410 Rent
- 5420 Insurance
Keep the main account list focused on decisions. Use sub-accounts, classes, customers, projects, or payroll dimensions for the extra detail.
For organizations with different reporting logic, the account structure can look very different. If you want to see how that changes in a restricted-fund environment, this guide to fund accounting for churches offers a useful contrast.
Sample Chart of Accounts Template for Service Businesses
Most small businesses should keep their chart of accounts between 30 and 50 total accounts for clarity and manageability, according to this chart of accounts setup guidance. That range works well because it forces discipline. You get enough detail to manage the business without creating a bookkeeping maze.
That doesn't mean every service business should use the exact same list. It means your starting point should be compact, logical, and easy to expand. If you want a downloadable version to work from, Steingard Financial provides a chart of accounts template for service businesses.
A practical template you can adapt
Below is a sample structure built for a service-based company that wants visibility into revenue mix, labor, and operating costs.
| Account Number | Account Name | Account Type | Description |
|---|---|---|---|
| 1010 | Checking Account | Asset | Primary operating bank account |
| 1020 | Savings Account | Asset | Reserve or tax savings account |
| 1100 | Accounts Receivable | Asset | Open customer invoices |
| 1200 | Prepaid Expenses | Asset | Prepaid software, insurance, or other advance payments |
| 1500 | Equipment | Asset | Computers and office equipment |
| 2010 | Credit Card Payable | Liability | Business credit card balance |
| 2100 | Accounts Payable | Liability | Unpaid vendor bills |
| 2200 | Payroll Liabilities | Liability | Payroll taxes and withholdings due |
| 2300 | Loan Payable | Liability | Business loan balance |
| 3010 | Owner Contribution | Equity | Capital contributed by owner |
| 3020 | Owner Draw or Distribution | Equity | Owner withdrawals |
| 3100 | Retained Earnings | Equity | Accumulated prior earnings |
| 4010 | Retainer Revenue | Revenue | Ongoing monthly service revenue |
| 4020 | Project Revenue | Revenue | Fixed-scope or milestone-based revenue |
| 4030 | Consulting Revenue | Revenue | Advisory or strategy work |
| 4040 | Other Service Revenue | Revenue | Miscellaneous service income |
| 5010 | Salaries, Client Services | Expense | Employee wages tied to service delivery |
| 5020 | Contractor Expense, Client Services | Expense | Contract labor used on client work |
| 5030 | Payroll Taxes | Expense | Employer payroll tax expense |
| 5040 | Employee Benefits | Expense | Health, retirement, and related benefits |
| 5050 | Salaries, Admin | Expense | Internal admin and management payroll |
| 5110 | Marketing and Advertising | Expense | Promotion and lead generation |
| 5120 | Sales Commissions | Expense | Variable selling costs |
| 5210 | Software, Client Facing | Expense | Tools used to deliver services |
| 5220 | Software, Admin | Expense | Internal business software |
| 5310 | Rent and Occupancy | Expense | Office or coworking space costs |
| 5320 | Insurance | Expense | Business insurance |
| 5330 | Office Supplies | Expense | Routine office purchases |
| 5340 | Telephone and Internet | Expense | Communications services |
| 5350 | Professional Fees | Expense | Legal, tax, and outside advisors |
| 5360 | Travel and Meals | Expense | Business travel and meals |
| 5370 | Training and Education | Expense | Staff development and education |
| 5380 | Bank and Merchant Fees | Expense | Banking and payment processing fees |
How to customize without breaking it
Don't add accounts just because a software menu makes it easy.
A better rule is to add a new account only if one of these is true:
- You review it regularly: The category supports pricing, hiring, or budgeting decisions.
- It behaves differently: The spending needs separate treatment for management or tax purposes.
- It reflects a real operating distinction: For example, contractor labor and employee labor should usually stay separate.
If a category won't change a decision, it probably doesn't need its own line on the chart.
Setting Up and Customizing Your COA in QuickBooks Online
QuickBooks Online gives you a starting point, not a finished structure. The default chart is broad, generic, and often loaded with accounts you won't use. For a service business, the job is to reshape that default list so QuickBooks supports real reporting without turning routine bookkeeping into a fight.

Start with the settings that matter
Before adding accounts, turn on account numbers if you plan to use them. Then review the existing list and make obvious inactive accounts disappear. You want a clean workspace before importing or building your final structure.
A straightforward setup process looks like this:
- Review the default chart and identify accounts that don't fit your business model.
- Activate account numbers so the list can follow your structure instead of alphabetical order.
- Add your core revenue and expense accounts from your template.
- Create parent and child relationships where detail needs to roll up cleanly.
- Test a few common transactions before you rely on automation.
If you need platform-specific help, this QuickBooks Online setup resource walks through the system side in more detail.
Use parent and child accounts on purpose
At this point, many service firms either overbuild or underbuild.
A parent account gives you a clean summary line. Child accounts let you preserve detail underneath it. That structure is especially useful for labor and software.
For example:
- 5000 Direct Costs
- 5010 Salaries, Client Services
- 5020 Contractor Expense, Client Services
- 5030 Payroll Taxes
- 5040 Employee Benefits
Or:
- 5300 Software
- 5310 Software, Client Facing
- 5320 Software, Admin
That way, the P&L can stay readable at the top level, while you still have drill-down detail when margins tighten.
Practical rule: If a category matters for review but clutters the main report, make it a child account, not a standalone top-level account.
Don't fight auto-categorization blindly
Auto-categorization is convenient until it starts flattening your data. A 2025 Gartner survey found that 52% of small businesses using auto-categorization tools report financial data distrust because their COA lacks the parent-child hierarchy needed to add detail to automatically tagged transactions.
That's why the right response usually isn't “turn it all off.” It's to build a chart that gives the software useful landing spots.
When bank feeds and payroll apps post transactions, they tend to prefer broad, familiar categories. If your chart only contains generic choices, the software will keep using them. If your chart contains a clear hierarchy, you can map common transactions into the right parent or child account and review exceptions instead of every line item.
Use this approach:
- Payroll apps: Map wages, payroll taxes, and benefits into distinct expense accounts.
- Bank feed rules: Send recurring software vendors to the correct software child account.
- Contractor payments: Route them to direct labor or admin labor based on function, not vendor name.
- Marketing charges: Separate delivery costs from client acquisition costs.
A lot of owners compare systems before deciding how much automation they want. If you're still weighing platforms, this Professional Careers Training guide for accountants gives a useful side-by-side view of QuickBooks, Xero, and Sage.
For a visual walk-through of QuickBooks chart setup, this video is a good companion while you build:
Test with real workflows
Don't judge the setup by whether the account list looks neat. Judge it by whether common workflows post correctly.
Run these tests:
- Invoice a retainer client and confirm revenue lands in the right service category.
- Process payroll and verify wages, taxes, and benefits split correctly.
- Book a contractor bill and make sure it doesn't merge into employee payroll.
- Categorize software charges and confirm client-facing tools stay separate from admin systems.
If those flows work, your chart of accounts setup is doing its job.
How to Map Your COA to Key Business KPIs
Once the structure is in place, the chart of accounts stops being a bookkeeping list and becomes a reporting engine. Owners then start getting answers instead of just reports.
The biggest payoff comes from aligning accounts with the same categories used in budgets and management review. Companies that align their Chart of Accounts with their budget categories from day one achieve 25% faster variance analysis and more accurate performance forecasting, according to this COA and budgeting alignment guide.
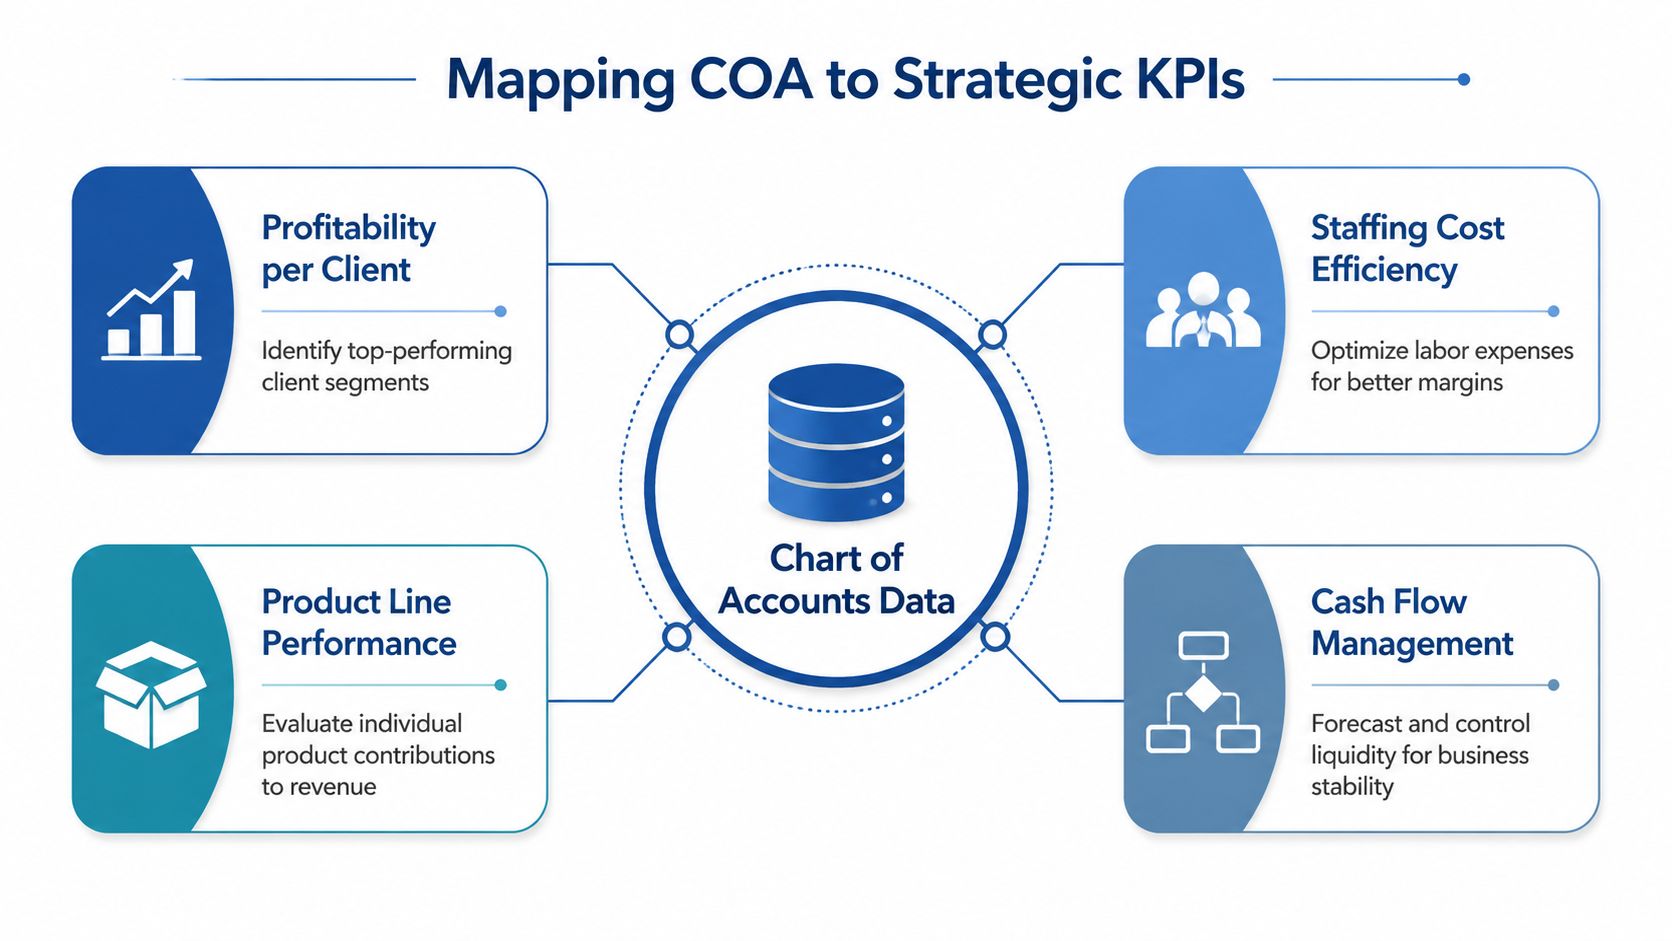
Four KPIs your COA should support
A service business doesn't need dozens of flashy dashboards. It needs a few reliable measures built from clean categories.
- Profitability by service line: Separate revenue accounts show which kind of work carries margin.
- Staffing cost efficiency: Distinct labor accounts show whether payroll and contractor mix make sense.
- Client or project profitability: Combined with classes, projects, or customer tracking, direct cost accounts reveal margin by job.
- Cash flow control: Balance sheet accounts and expense timing show whether profits are translating into usable cash.
What the mapping looks like in practice
Suppose your chart separates revenue into retainer, project, and consulting income. On the cost side, it separates direct salaries, contractor labor, payroll taxes, and benefits from admin payroll and general overhead.
That one design choice lets you review questions like:
| Business question | COA structure that supports it |
|---|---|
| Which service line is strongest? | Separate revenue accounts by service type |
| Are delivery wages too high? | Direct client labor separated from admin labor |
| Are contractors replacing margin? | Contractor costs kept distinct from employee costs |
| Is software hurting job profitability? | Client-facing software separated from admin software |
This is also where management reporting becomes easier to maintain. If the budget says “Client Delivery Labor,” “Sales and Marketing,” and “General Admin,” your chart should use the same logic. If the budget and chart use different language, every monthly review turns into translation work.
For firms that want cleaner internal reporting, this MIS and reporting resource shows how structured accounting data feeds management reporting.
When a KPI is hard to calculate every month, the problem is often the account structure, not the reporting tool.
People strategy belongs in the numbers
A service company's people plan should show up in the chart of accounts.
If you're deciding whether to hire an employee, use a contractor, or shift work between roles, your reports need to reflect those distinctions consistently. Separate labor-related costs by function and type. Then use projects, departments, or classes to add another layer where needed.
That's how a chart of accounts setup helps with pricing, staffing, and margin protection. Without that structure, owners tend to make people decisions on instinct. With it, they can see what each role costs the business and where the return sits.
Common COA Mistakes and How to Keep Your Books Clean
Most chart of accounts problems don't start with a bad intention. They start with small, reasonable decisions made over time. Someone adds a duplicate account because they can't find the original. A payroll integration posts to a generic category. A bookkeeper creates a vendor-specific expense account to solve one immediate problem. Six months later, the reports are cluttered.
That drift is common. Industry audits show that without a recurring review schedule, 40 to 60% of chart of accounts in small businesses become redundant, outdated, or unclear within two years, a problem often called COA drift, according to HubiFi's chart of accounts best practices.
The mistakes that create mess fast
The biggest issues usually look like this:
- Duplicate naming: “Office Rent” and “Monthly Lease” both exist, so spending gets split.
- Vendor-based accounts: Separate accounts get created for specific suppliers instead of for expense types.
- Too much detail in the wrong place: The chart carries client, vendor, and project detail that should live elsewhere in the system.
- No rules for additions: Team members add accounts whenever they hit uncertainty.
- Old accounts stay active: Categories no longer used remain available and continue to collect stray transactions.
Clean books don't come from having more accounts. They come from having fewer, clearer ones and enforcing the rules around them.
A simple governance routine
You don't need a heavy policy manual. You need a repeatable maintenance habit.
Use a short review process every quarter or at least annually:
- Scan for duplicates and merge accounts that represent the same thing.
- Archive inactive accounts so staff can't keep posting into outdated categories.
- Review naming consistency across payroll, software, occupancy, and direct labor accounts.
- Check mappings from apps like payroll and bank feeds to confirm they still hit the right accounts.
- Update a one-page account guide that explains what belongs in each key category.
That last item matters more than people expect. A simple internal data dictionary prevents subjective coding. If one person thinks “client-facing software” includes Zoom and another thinks it belongs in admin software, you'll get inconsistent reporting no matter how smart the chart looks on paper.
What good maintenance looks like
A healthy chart of accounts feels boring in the best sense. The same transactions land in the same places each month. New accounts get added rarely and for a clear reason. Reports stay readable. Month-end review focuses on business performance, not cleanup.
If your books already feel cluttered, don't rebuild everything at once. Start by standardizing names, consolidating obvious duplicates, and tightening mappings from payroll and bank feeds. Order returns quickly once the underlying list is clean.
If your chart of accounts setup isn't giving you clear visibility into labor, profitability, and cash flow, Steingard Financial helps service businesses clean up the structure, map payroll and bookkeeping systems correctly, and build reporting that supports real operating decisions.