

Debt Equity Ratio Interpretation: Boost Your Business
You open QuickBooks at the end of the month, glance at the balance sheet, and see a mix of liabilities, equity, retained earnings, and credit card balances. The business feels healthy. Clients are active, payroll is running, and work is moving. But one question keeps hanging there: are we growing with discipline, or leaning too hard on debt?
That question is common for service business owners because service companies often look stable on the surface. You may not have warehouses, heavy equipment, or large inventory purchases. But that doesn't mean debt can't create pressure unnoticed. A line of credit, credit cards, tax liabilities, software financing, and owner draws can change the picture faster than many owners expect.
The debt equity ratio interpretation process helps turn that fog into something useful. It tells you how much of your business is financed by what you owe versus what the owners have built and retained. It won't answer every financial question by itself, but it gives you a fast read on risk, flexibility, and financing posture.
For service businesses, this matters even more. Generic advice on debt-to-equity often assumes a capital-heavy business model. That can lead a consulting firm, agency, bookkeeping practice, or software-enabled service company to think a ratio is “fine” when it may be aggressive for an asset-light company.
Introduction Navigating Your Business's Financial Health
A lot of owners review financials in fragments. They look at revenue first, then bank balance, then payroll, then whether receivables are coming in. The balance sheet often gets the least attention because it feels less intuitive than a profit and loss statement.
That’s where financial borrowing can hide.
A service business can look profitable and still take on a balance sheet structure that limits options. You might be funding growth with borrowed money because client payments are slow. You might be carrying old tax balances. You might have financed hiring before revenue became predictable. None of those choices are automatically wrong. But each one changes your risk.
Practical rule: If your balance sheet makes you hesitate, start with one ratio instead of trying to decode every line at once.
The debt-to-equity ratio gives that first anchor. It helps answer practical questions like these:
- Are lenders financing more of the business than the owners are?
- Would a revenue slowdown create immediate pressure?
- Are we in a normal range for a service company, or drifting into a more debt-reliant position than we realize?
For a busy owner, this ratio is useful because it simplifies a big question. It doesn't ask you to become a finance expert overnight. It asks one thing: how much does the business owe relative to what it owns net of those obligations?
Once you understand that relationship, other decisions get clearer. Should you take another loan? Keep more profit in the business? Delay distributions? Tighten collections? Each of those decisions connects back to the same core issue, your capital structure.
What Is the Debt to Equity Ratio
At its simplest, the debt-to-equity ratio compares total liabilities to shareholders’ equity. The standard formula is Total Liabilities ÷ Shareholders’ Equity, as explained in this debt-to-equity ratio valuation overview.
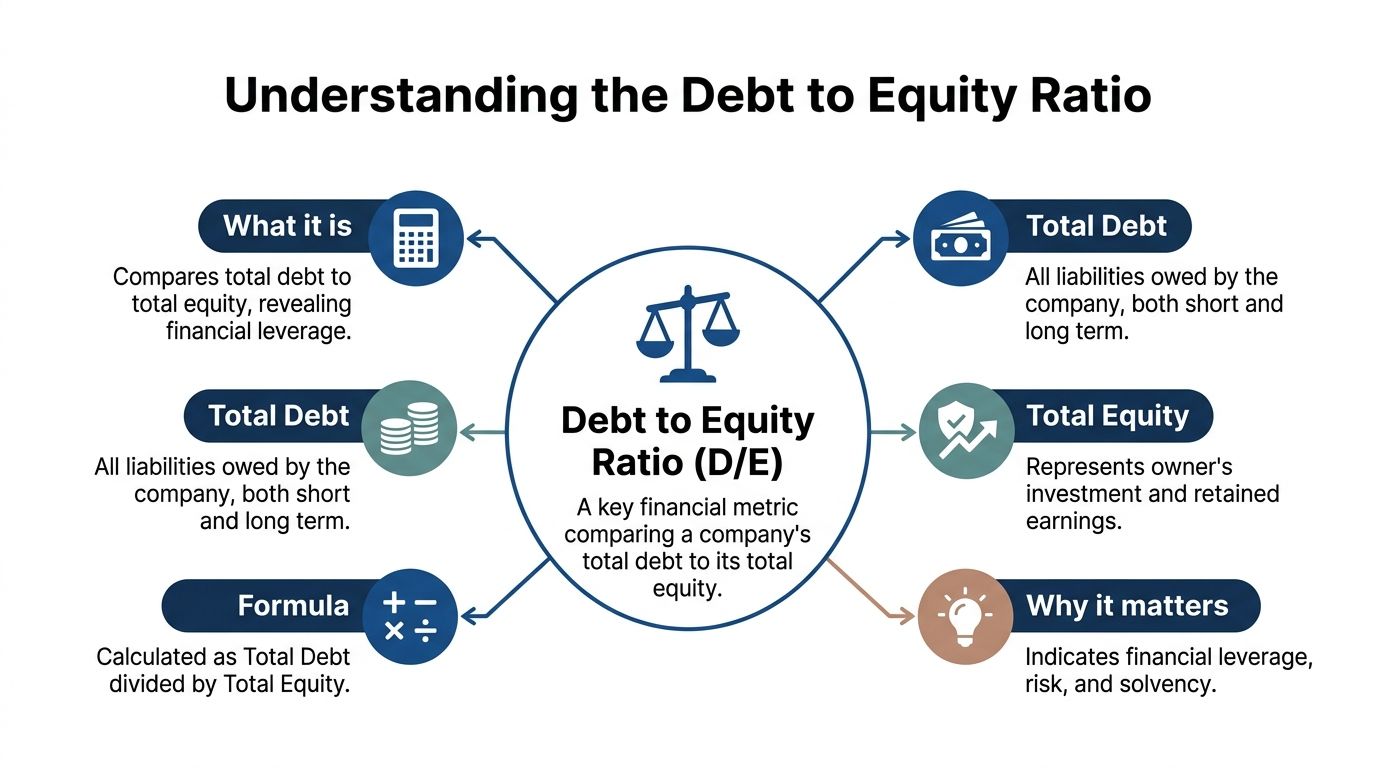
If you want a plain-English version, think about buying a house. Part of the home is financed by a mortgage. The rest is your equity, meaning the portion you own outright. A business works the same way. Some of it is financed by obligations to others. Some of it is supported by owner investment and profits kept in the company.
What counts as debt in this ratio
In the standard version of the ratio, “debt” usually means total liabilities, not just bank loans.
That can include:
- Accounts payable, such as vendor bills you haven't paid yet
- Credit card balances carried by the business
- Payroll and tax liabilities
- Lines of credit and term loans
- Other short-term and long-term obligations
That broad definition matters because many owners hear “debt” and think only of loans. On a balance sheet, the ratio is wider than that.
What equity means
Shareholders’ equity is the owners’ stake in the business after liabilities are subtracted from assets. In practical terms, it usually reflects owner contributions plus retained earnings, adjusted for losses and distributions.
If your business has built profits and left some of them in the company, that usually supports equity. If losses or large distributions have reduced the company’s net worth, equity can shrink.
For owners who want a clearer foundation before diving into ratios, this guide on how to read a balance sheet is a useful companion.
Why the ratio matters
This ratio isn't just a bookkeeping exercise. It affects how outsiders view your company and how expensive capital may become. The same valuation source notes that as D/E increases, the re-levered beta rises, which can raise the cost of equity in valuation models through CAPM. In simple terms, a higher D/E ratio can make the business look riskier, and riskier businesses usually face more expensive capital.
A low ratio doesn't mean you're timid. A high ratio doesn't mean you're reckless. It means your financing mix deserves interpretation in context.
Here's the basic logic:
| Component | What it tells you |
|---|---|
| Higher liabilities | More dependence on obligations that must be managed and repaid |
| Higher equity | A stronger owner cushion and usually more flexibility |
| Higher D/E ratio | More leverage and typically more financial sensitivity |
| Lower D/E ratio | More conservative funding and generally more resilience |
This is why debt equity ratio interpretation matters more than the formula alone. Two businesses can have the same ratio and very different realities. But until you know the number and what sits behind it, you're making financing decisions in the dark.
How to Calculate Your D/E Ratio in QuickBooks
Most owners don't need a complex model to calculate this. If your books are current, the number is already sitting on your balance sheet.

Find the two numbers that matter
In QuickBooks Online, run a Balance Sheet report for the period you want to review. Most owners should use month-end so they can compare one month to the next on a clean basis.
You’re looking for two lines:
- Total Liabilities
- Total Equity
Then divide total liabilities by total equity.
If your QuickBooks setup feels cluttered or inconsistent, getting the chart of accounts and reporting structure right makes this much easier. This walkthrough on setting up QuickBooks Online for service businesses helps owners build cleaner reports from the start.
A simple example
Suppose your service business shows $50,000 in total liabilities and $100,000 in total equity. Your D/E ratio is 0.5.
That means the business has $0.50 of liabilities for every $1 of equity.
If the numbers were equal, your ratio would be 1.0. If liabilities were higher than equity, the ratio would rise above that.
What to watch in QuickBooks
The formula is easy. The classification work behind it is where mistakes happen.
Common issues include:
- Misclassified owner draws that distort equity
- Unreconciled credit cards that overstate or understate liabilities
- Payroll liabilities that haven't been cleared correctly
- Old journal entries left behind after cleanup work
- Balance sheet timing problems when books aren't fully closed for the month
A D/E ratio is only as good as the bookkeeping behind it. If the balance sheet is messy, the interpretation will be messy too.
Quick check: Before trusting the ratio, make sure bank accounts, credit cards, loans, and payroll liabilities are reconciled through the same date.
Here’s a practical way to review it each month:
| Step | What to do in QuickBooks | Why it matters |
|---|---|---|
| Run the report | Open the Balance Sheet for month-end | Keeps comparisons consistent |
| Confirm liabilities | Review loans, cards, AP, taxes | Prevents understating leverage |
| Confirm equity | Check retained earnings and owner activity | Avoids distorted denominator |
| Calculate the ratio | Liabilities divided by equity | Gives your leverage snapshot |
| Compare trend | Review against prior months | Shows whether risk is rising or easing |
If you'd rather see a visual walkthrough before doing the math yourself, this short video can help.
One caution owners often miss
If equity is very small, the ratio can look extreme fast. If equity is negative, the standard ratio becomes less useful as a decision tool. That's not a reason to ignore it. It's a reason to stop and examine what's driving the balance sheet.
For most service companies, a clean monthly calculation in QuickBooks gives you a practical trendline. That trendline is often more useful than staring at one isolated number.
A Guide to Debt to Equity Ratio Interpretation
A service business owner checks the balance sheet, sees a debt-to-equity ratio of 1.1, and assumes that sounds fine because an online article says anything around 1 is normal. For a law firm, agency, IT services company, or bookkeeping practice, that conclusion can be off. Businesses with few hard assets usually have less room for debt than businesses built around equipment, real estate, or inventory.
That is why debt equity ratio interpretation has to start with business model, not a generic chart.
For a service company, the ratio works like a stress test for your financing mix. It shows how much of the business is supported by obligations you must repay versus owner capital and retained profits that give you breathing room. If your company runs on people, systems, and recurring client work, a ratio that looks ordinary in another industry may be high for you.
Why service businesses need a different lens
A manufacturer may borrow to buy machines that produce revenue for years. A service firm often borrows for a different reason. It may be covering payroll during slow collections, financing growth before new clients fully ramp up, or filling gaps created by uneven cash flow.
Those are not automatically bad uses of debt. But they deserve closer reading because the business may not have many physical assets to sell or refinance if cash gets tight.
That is the piece generic guides often miss. In service businesses, the balance sheet is usually lighter, so the margin for error is often thinner.
What a "good" ratio usually means here
Instead of treating one number as universally good or bad, read it in ranges and then adjust for your type of service business.
| D/E Ratio Range | What it often suggests for a service business |
|---|---|
| Lower ratio | More owner-funded growth, stronger balance sheet cushion, and more flexibility when revenue timing gets choppy |
| Middle range | May be reasonable, but deserves review if profits are inconsistent or collections are slow |
| Higher ratio | Greater dependence on borrowed funds or accumulated obligations, which can create pressure faster in an asset-light company |
| Very high or negative equity situation | The standard ratio becomes less useful by itself. You need to examine the balance sheet line by line |
A practical example helps. If two companies each show a ratio of 1.2, the meaning can be very different. For a construction company with financed equipment, that may fit the business. For a consulting firm with modest fixed assets, it can mean the company is carrying more debt than its operating model comfortably supports.
How to read your own number without overreacting
Start with three questions.
- Is the ratio consistent with how your business operates?
- Is it improving, holding steady, or drifting up over time?
- Is debt helping you fund profitable growth, or is it covering operating shortfalls?
That last question matters most. Borrowing to bridge a short, predictable gap while receivables clear is one thing. Borrowing month after month to make payroll is a different signal.
Owners also get tripped up by equity. If equity is small, the ratio can look large very quickly. If equity is negative, the ratio stops being a clean benchmark and becomes more of a warning light. At that point, you are usually better off reviewing the balance sheet as a whole instead of focusing on one formula.
If you want a broader frame for reading ratios together instead of in isolation, this guide to financial statement analysis shows how balance sheet measures connect to the rest of your numbers.
Compare to similar businesses, not random benchmarks
For service-based businesses, sideways comparison is usually more useful than broad industry averages. A marketing agency, CPA firm, staffing company, and software-enabled service business may all be "service" companies, but their cash cycles and financing needs can still differ. The point is to compare yourself to businesses with similar economics, not merely to the first benchmark that appears in search results.
That is also why ratio interpretation should sit beside profitability, cash flow, and liquidity review. These other financial ratio analysis examples are helpful because they show how one ratio can look acceptable until you place it next to the rest of the financial picture.
For a busy owner using QuickBooks, the simplest rule is this. Do not ask, "Is this ratio good in general?" Ask, "Does this ratio make sense for an asset-light service business like mine, and is it helping or hurting flexibility?" That question usually leads to better decisions.
What Your D/E Ratio Reveals About Business Risk
A high D/E ratio isn't just a label. It changes how your business behaves under pressure.
When debt is high relative to equity, fixed obligations don't disappear when revenue gets uneven. Client work may slow down. Collections may come in late. Pricing pressure may show up. But loan payments, interest, and other liabilities still demand attention.

The pressure shows up in cash flow first
According to this explanation of how D/E affects financial stability, companies with ratios exceeding 1.5 become significantly more vulnerable to economic downturns and interest rate fluctuations. That vulnerability shows up as pressure on cash flow, higher financing costs, and reduced liquidity.
That language matters because owners often think debt risk is only about bankruptcy or default. In real life, the first symptom is usually tighter operating room.
You feel it when:
- Payroll week arrives before receivables clear
- A lender asks more questions than usual
- New borrowing comes with worse terms
- You pass on hiring because cash feels too tight
- A slow quarter creates stress faster than it should
Lenders and buyers read the balance sheet differently than owners do
Owners usually know why debt increased. Maybe you hired ahead of growth. Maybe you covered timing gaps. Maybe you cleaned up old liabilities and are now seeing the full picture.
Lenders, investors, and buyers don't start with your story. They start with your ratios.
If the level of borrowing looks high, they may assume the business has less flexibility. In M&A contexts, one guide notes that the market often treats significant reliance on debt as a valuation issue, not just a solvency issue. That’s why smart owners consider not just whether they can carry the debt, but how that debt changes outside perception.
For a thoughtful perspective on whether the use of debt is good or bad, it's useful to remember that debt isn't necessarily harmful. The problem is mismatch. If the debt load doesn't fit the predictability and margin profile of the business, risk rises quickly.
A service company with a modest asset base usually needs financial flexibility more than financial engineering.
Low D/E creates breathing room
A lower ratio usually means the business has a larger equity cushion. That doesn't guarantee safety, but it often gives management more options. You can absorb a late-paying client, slower sales cycle, or temporary margin dip without every decision becoming a financing decision.
That freedom has practical value:
| If D/E is lower | What it often means operationally |
|---|---|
| More equity support | More room to absorb business volatility |
| Less dependence on borrowed funds | Fewer fixed obligations pulling on cash |
| Better flexibility | Easier to make strategic decisions without lender pressure |
| Stronger resilience | More capacity to handle slow periods and rate shifts |
For service firms, resilience usually matters more than maximizing borrowed funds. You’re selling expertise, time, systems, and execution. That model tends to reward financial agility.
Beyond the Standard D/E Ratio
The debt-to-equity ratio is useful, but it doesn't deserve total control over your judgment. A single metric can point you in the right direction and still leave out important context.
For example, the standard formula includes total liabilities. That means operating liabilities like accounts payable can influence the result alongside loans and lines of credit. In some businesses, that’s appropriate. In others, it can blur the difference between structural debt financing and normal working capital movement.
Complementary ratios add needed clarity
One reason experienced analysts don't stop at D/E is that they also want to know whether the business can service debt from operations.
A useful reference on debt-equity analysis in transaction settings notes that high D/E ratios above 2.0 can amplify financial distress risks, and that buyers also check Debt/EBITDA and interest coverage to assess refinancing risk. That same source notes that Debt/EBITDA is often capped at 6x in LBO models.
You don't need to run a buyout model on your business to learn from that. The lesson is simple: financial structure should be tested from more than one angle.
Metrics worth pairing with D/E
Here are the most useful companions:
- Interest coverage checks whether earnings can support interest obligations
- Debt-to-assets shows how much of the company’s asset base is financed by debt
- Debt/EBITDA helps estimate how heavy the debt burden is relative to operating earnings
- Trend analysis shows whether your debt levels are improving or drifting
Decision lens: Use D/E to spot capital structure risk, then use supporting ratios to see whether the business can comfortably carry that structure.
Why this matters for service businesses
Service firms often have balance sheets that can swing with timing. One month may show larger payables, accrued payroll, or tax liabilities. Another may show stronger cash and retained earnings after collections come in. If you read one isolated D/E ratio without checking the supporting metrics, you can overreact or miss a real issue.
A better approach is to build a small dashboard.
| Metric | Main question it answers |
|---|---|
| Debt-to-equity | How much are we relying on liabilities versus owner value? |
| Interest coverage | Can operations comfortably support financing costs? |
| Debt-to-assets | How much of the business is financed through obligations? |
| Trend over time | Are we moving toward more stability or more risk? |
That's especially important when the books are updated monthly and management wants to make hiring, compensation, or growth decisions based on current data rather than instinct.
Actionable Steps to Improve and Manage Your Ratio
A high debt-to-equity ratio in a service business usually does not mean the business model is weak. It often means cash is arriving later than expenses are due, owner draws are running ahead of profit, or debt that started as a short-term patch has become part of the normal routine.
That is good news, because those are management issues you can fix.
For service firms, this ratio works a bit like body temperature. One reading matters, but the pattern matters more. If your QuickBooks balance sheet shows the ratio creeping up for three or four months, the goal is not panic. The goal is to identify which habit is pushing it up and correct that habit early.
Prioritize debt with a method, not by instinct
"Pay down debt" is too vague to be useful. Start by listing every interest-bearing balance from QuickBooks, including lines of credit, term loans, vehicle loans, and credit cards. Then sort them two ways:
- By interest rate. This is the debt avalanche method. It reduces financing cost fastest.
- By smallest balance. This is the debt snowball method. It creates faster wins and helps some owners stay consistent.
Both methods can work. The right choice depends on behavior. If your business tends to lose focus after a busy month, the snowball method may keep momentum going. If cash is tight and interest cost is the bigger problem, the avalanche method is usually the better fit.
For many service businesses, I suggest one more filter. Pay special attention to short-term debt used to cover recurring operating gaps. A credit card balance tied to payroll or rent is often more urgent than a lower-rate equipment note, because it signals a timing problem that can repeat every month.
Protect equity by setting a draw rule
Equity often weakens subtly. The business makes money, but the owner takes most of it out, so the balance sheet never gets stronger.
A simple rule helps. Instead of taking draws whenever cash looks healthy, set a policy tied to completed monthly bookkeeping. For example, review net income after the month is closed in QuickBooks, then decide what portion stays in the business. That keeps distributions connected to real profit, not to the checking account balance on a busy week.
Here is the math in plain English. Suppose a consulting firm has $200,000 in liabilities and $100,000 in equity. Its D/E ratio is 2.0. If the firm retains an extra $2,000 per month instead of distributing it, equity grows by $24,000 over a year. If liabilities stay flat, the ratio falls to about 1.6. No refinancing. No dramatic overhaul. Just steady profit retention.
That is why owner distributions deserve a separate review. In service businesses with few physical assets, equity can be thin to begin with, so repeated draws have a bigger effect on the ratio than many owners expect.
Fix the cash cycle before adding new borrowing
Service firms often borrow because cash is late, not because the business needs heavy long-term financing. That distinction matters.
If work is completed this week, invoiced next month, and collected a month after that, debt fills the gap. Over time, the line of credit stops being occasional support and starts acting like permanent working capital. The ratio rises, even if sales are healthy.
A practical reset looks like this:
- Send invoices immediately after work is completed
- Require deposits or milestone billing for larger projects
- Follow up on overdue receivables every week, not only at month-end
- Match vendor payment timing to actual terms instead of paying reactively
- Review payroll tax and credit card balances separately so they do not hide inside general liabilities
Small collection improvements and cleaner liability management often do more for your ratio than a major restructuring.
Use QuickBooks to catch problems early
This ratio becomes useful when it turns into a monthly habit. QuickBooks can support that if the books are current and liability accounts are classified correctly.
For a service business, I recommend a short monthly review after closing the books:
| Monthly habit | Why it matters |
|---|---|
| Reconcile bank, credit card, and loan accounts | Catches balances that are overstated, understated, or posted to the wrong place |
| Review the balance sheet line by line | Helps you separate true debt from routine operating payables |
| Calculate D/E the same way each month | Makes month-to-month changes meaningful |
| Compare this month with the prior three to six months | Shows whether your debt position is improving or getting tighter |
| Review distributions next to net income | Reveals whether owner withdrawals are weakening equity |
| Check A/R aging with the ratio | Shows whether slow collections are the real cause |
That last point is especially important for service businesses. Because they usually have fewer hard assets, the balance sheet can change quickly based on billing timing, payroll accruals, and owner activity. A clean monthly close gives the ratio context.
A better ratio rarely comes from one big move. It usually comes from a series of smaller, disciplined decisions that strengthen cash flow, protect equity, and keep debt from becoming the default answer to ordinary timing problems.