 Skip to content
You may already have this problem sitting on a shelf.
Maybe it’s an HVAC shop with bins of motors, capacitors, and control boards. Maybe it’s a field service company with replacement parts in vans. Maybe it’s a project-based business that keeps materials on hand so jobs don’t stall. In every case, those items represent cash you’ve already spent.
That’s why inventory turns calculations matter. They tell you how quickly inventory moves back into the business as revenue-producing work. For a service business owner, that’s not just an accounting ratio. It’s a decision tool for purchasing, pricing, stock levels, and cash flow.
Why Inventory Turns Matter More Than You Think
A lot of owners look at inventory and ask one narrow question: “Do we have enough on hand?” That matters, but it’s incomplete. The better question is, “How much cash is tied up here, and how fast is it cycling back out?”
If inventory sits too long, cash gets trapped. You may still be profitable on paper, but feel short on operating cash. Payroll hits. Vendors need to be paid. Equipment needs repair. Suddenly the parts room starts affecting decisions far outside the stockroom.

What inventory turns actually tell you
Inventory turns measure how often your business moves through its average inventory over a period. Higher turns usually mean inventory is moving efficiently. Lower turns often mean money is sitting in stock longer than it should.
For service businesses, this shows up in practical ways:
- Cash flow pressure: You’ve bought more parts or materials than current demand requires.
- Storage drag: Shelves, cages, and service vans fill up with items that don’t move.
- Purchasing blind spots: Buyers reorder based on habit instead of usage.
- Obsolescence risk: Old parts remain on hand for work you rarely do now.
That’s why I treat inventory turns as a business health indicator, not just a formula on a report.
Practical rule: If your inventory number on the balance sheet keeps rising but operations don’t feel easier, your turns deserve a closer look.
Why service businesses get misled
Most articles about inventory turnover are written with retailers in mind. Retail businesses buy products to resell them quickly. Service companies often don’t work that way.
You may carry stock because technicians need it ready for urgent calls. You may keep project materials available because supplier delays can wreck scheduling. You may even hold backup inventory to protect service levels for key clients.
None of that is wrong. But it means a simple retail-style interpretation can lead you astray.
A service owner can look at a turnover ratio and think inventory is healthy, while the operations team knows the shelves are full of slow-moving items. That disconnect usually comes from one of two problems. Either the business is using the wrong formula, or it’s using weak inventory averages.
The real value of the metric
When you calculate turns correctly, the ratio helps you answer better questions:
- Which categories deserve tighter reorder controls?
- Which parts justify safety stock?
- Which materials should be purchased per job instead of held in bulk?
- Where is excess inventory absorbing working capital?
If you’re busy, that’s the key takeaway. Inventory turns calculations help turn inventory from a vague cost center into a controllable financial lever.
The Core Formulas for Calculating Inventory Turns
At the center of this topic is a simple ratio. The confusion starts when owners try to decide which numbers belong in it.
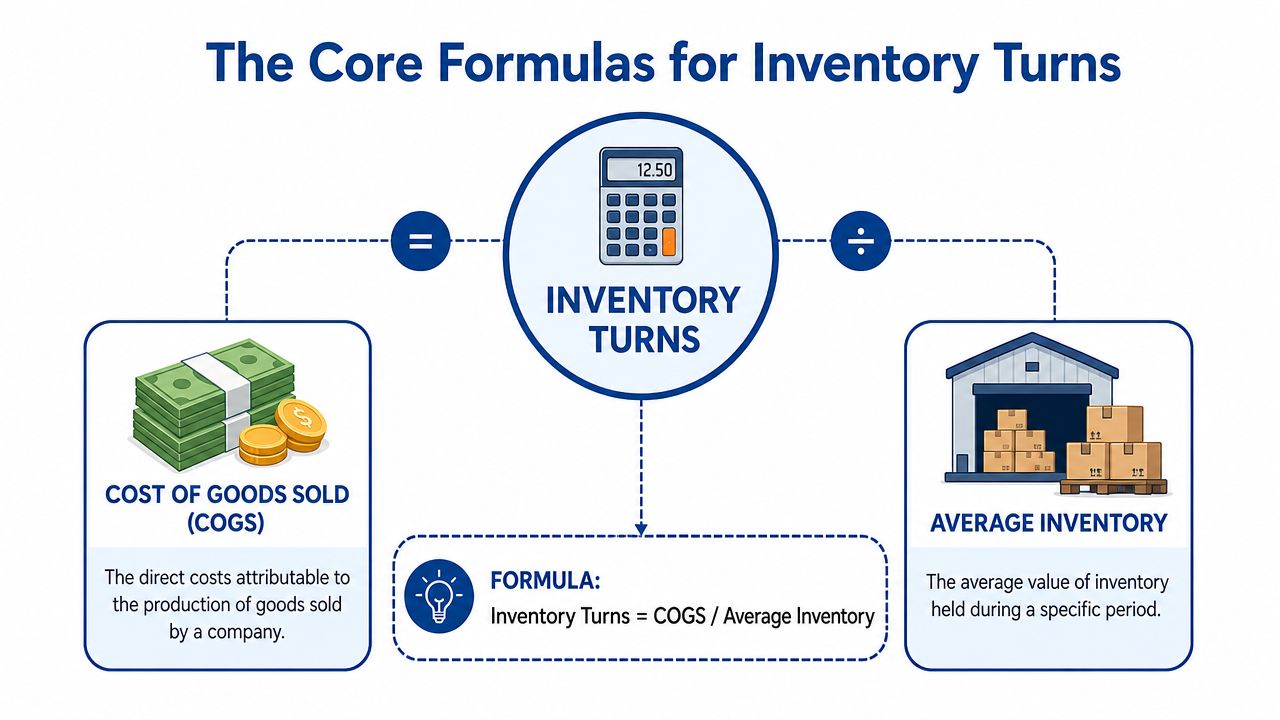
The visual below shows the classic version most accountants start with.
The standard formula most businesses use
The common formula is:
Inventory Turns = Cost of Goods Sold ÷ Average Inventory
That’s the version you’ll usually see in accounting discussions, and it’s the cleanest place to start. If you want a quick refresher on what belongs in COGS, this overview of cost of goods sold is useful before you build the ratio.
Here’s a simple example:
- Cost of goods sold: $120,000
- Average inventory: $30,000
Inventory turns = 120,000 ÷ 30,000 = 4
That means the business turned through its average inventory four times during the period.
For many businesses, that’s a workable measurement. It aligns the cost flowing through the income statement with the inventory asset sitting on the balance sheet. The cost side of that ratio is worth being precise about, and What Is The Cost Of Sales A Practical Guide For Your Business sets out what belongs in it.
The sales-based shortcut
Some owners use sales instead of COGS:
Inventory Turns = Sales ÷ Average Inventory
This shortcut can be tempting because sales is easier to recognize and easier to pull from reports. But it mixes a selling-price figure with an inventory-cost figure. That can blur the picture.
A quick numeric example shows why:
- Sales: $200,000
- Average inventory: $30,000
Sales-based turns = 200,000 ÷ 30,000 = 6.67
That result is higher than the COGS-based version, not because inventory moved faster, but because the numerator includes markup.
If you want a non-technical explainer that compares the basics of the inventory turnover ratio, that resource can help frame the difference before you settle on your internal reporting method.
After the formula feels familiar, this short walkthrough can help reinforce the mechanics:
The formula service businesses often need instead
Retail-style advice starts to fall short.
A frequently missed issue is whether turns should be based on COGS or inventory usage. One industry source notes that while many explainers stop at COGS ÷ average inventory, service-parts environments should use annual inventory usage and subtract safety stock from the denominator to avoid overstating turns, because stock held intentionally for service levels can make inventory appear more efficient than it really is in a standard retail-style formula (eTurns on inventory turnover calculations).
That matters if you hold:
- replacement parts for emergency service
- maintenance stock for contractual clients
- project materials staged in advance
- buffer inventory to avoid missed service calls
When the numerator and denominator don’t match your operating reality, the ratio stops being useful.
Here’s a plain-language example.
Suppose a service company keeps a base level of critical parts on hand so technicians can respond quickly. If you calculate turns using the full inventory balance, the business may look more efficient than it feels operationally. Why? Because some of that stock isn’t really available for ordinary turnover decisions. It’s there as a service commitment.
In that case, using inventory usage and adjusting for safety stock gives management a better decision-making number.
Which formula should you use
Use the standard COGS ÷ average inventory formula when your inventory behaves like a normal cost flow tied directly to revenue production.
Use a usage-based version when inventory exists partly to support service response, maintenance commitments, or project readiness. That version often matches operational reality better.
The goal isn’t to find one universal formula. The goal is to choose a formula that reflects how your business consumes inventory.
Calculating Average Inventory Three Different Ways
Most errors in inventory turns calculations don’t come from the numerator. They come from the denominator.
If your inventory rises and falls during the year, a weak average can make a solid business look sloppy, or make an overstocked business look efficient. That’s why average inventory deserves more attention than it usually gets.
Method one using beginning and ending inventory
The simplest method is:
Average Inventory = (Beginning Inventory + Ending Inventory) ÷ 2
Example:
- Beginning inventory: $20,000
- Ending inventory: $40,000
Average inventory = (20,000 + 40,000) ÷ 2 = $30,000
This method is quick and easy. If your inventory stays fairly stable, it may be good enough for monthly review or a fast year-end check.
Its weakness is obvious. It ignores what happened in the middle. If inventory spiked for several months and then dropped right before reporting, the simple average can hide the problem.
Method two using monthly averages
A better method for many service businesses is to average the monthly ending balances across the period.
Suppose your monthly inventory balances were:
| Month | Inventory value |
|---|---|
| January | $20,000 |
| February | $22,000 |
| March | $24,000 |
| April | $35,000 |
| May | $38,000 |
| June | $40,000 |
Add those balances and divide by the number of months. That gives you an average based on what you maintained through the period, not just two snapshots.
This works especially well when inventory changes with:
- Seasonality: Busy and slow service cycles
- Project staging: Materials purchased before major jobs
- Lead time swings: Larger buys made when suppliers are less reliable
For management use, this is often the best balance of effort and accuracy.
A good average should represent how inventory lived during the period, not just how it looked on two dates.
Method three using a rolling average
A rolling average is more dynamic. Instead of waiting for year-end, you keep updating the average using the most recent months.
That helps when owners want to monitor trends instead of just producing a backward-looking annual ratio. If turns weaken over several periods, you’ll see that sooner.
A rolling average is useful when:
- purchasing patterns shift during the year
- service demand changes quickly
- you want monthly KPI tracking
- managers need near-current information, not stale annual summaries
Choosing the right method
Here’s the practical hierarchy I recommend:
- Use the simple method if you need a fast estimate and inventory is stable.
- Use monthly averaging if stock levels move materially during the year.
- Use a rolling average if you actively manage purchasing and want an operating KPI.
If your balance sheet inventory fluctuates, the second and third methods usually tell the truth more clearly than the first. That matters because the ratio is only as reliable as the denominator.
If you want to understand where inventory sits in your financial statements before calculating anything, this guide to reading a balance sheet is a good companion.
Pulling the Numbers from QuickBooks and Excel
A formula is useless if the numbers are buried in software or spread across multiple spreadsheets. The good news is that most owners already have the inputs. They just haven’t pulled them into one repeatable process.
Finding the numbers in QuickBooks
In QuickBooks, start with two reports:
- Profit and Loss report: Look for Cost of Goods Sold
- Balance Sheet report: Look for Inventory Asset
Run both reports for the same period. If you’re calculating annual turns, use the full year. If you’re monitoring monthly performance, stay consistent and use monthly reports throughout.
For average inventory, don’t rely on one balance sheet date if inventory moves around. Pull inventory asset balances at regular points, usually month-end, and keep them in a simple tracking file.
If your setup isn’t clean, the numbers can mislead you. A service business often needs a thoughtful QuickBooks structure so parts, materials, and direct job costs land in the right places. This overview of QuickBooks Online setup for service businesses is worth reviewing if your chart of accounts or item mapping feels messy.
Building a simple Excel tracker
Excel is still one of the best tools for monitoring turns because it makes trend review easy.
Set up a sheet with columns like these:
| Month | Ending Inventory | Period COGS or Usage | Average Inventory | Inventory Turns |
|---|---|---|---|---|
| Jan | ||||
| Feb | ||||
| Mar |
Then use formulas to calculate:
- Simple average inventory from two points
- Monthly average inventory across several balances
- Turns using your chosen numerator
This gives you a living dashboard instead of a one-time calculation.
Keep the process clean
Owners often run into trouble because the books and operations use different language. Accounting may call something inventory. Operations may think of it as truck stock, install material, or backup service parts.
That disconnect creates bad reports.
Use one naming convention and one method consistently. If you switch from COGS-based turns to usage-based turns, label it clearly. If you exclude safety stock for internal management, document that rule in the workbook.
A simple process usually works best:
- Pull reports on the same day each month
- Use the same averaging method every period
- Keep one worksheet per inventory category if needed
- Review exceptions, not just totals
That last point matters. Total inventory turns may look acceptable while one category is bloated. Excel helps you spot those pockets quickly.
What Is a Good Inventory Turnover Ratio
The honest answer is that a “good” ratio depends on what kind of inventory you hold and why you hold it.
For a service business, a lower ratio isn’t automatically bad. If you keep critical parts to support response time, some inventory is there by design. On the other hand, a higher ratio isn’t automatically healthy either. If technicians run out of key items, strong turns can hide service failures.
How to interpret high and low turns
A high turnover ratio often points to lean stock levels and efficient movement. It can also mean you’re cutting inventory too close and increasing the risk of delays, rush orders, or missed service commitments.
A low turnover ratio often suggests overbuying, weak forecasting, or slow-moving items. But there are exceptions. Some businesses carry specialty parts with long lead times, and the lower turn is a deliberate tradeoff.
The goal is balance. You want inventory to move, but you also need enough on hand to protect operations.
The best ratio is the one that supports both cash flow and service reliability.
A starting-point comparison table
Use industry comparisons carefully. They can help frame discussion, but they shouldn’t overrule your business model.
Because no verified benchmark figures are available here, the table below is intentionally qualitative.
| Industry | Typical Turnover Ratio |
|---|---|
| HVAC service | Varies based on emergency parts mix, seasonality, and truck stock policies |
| Plumbing service | Often depends on standard repair parts versus specialty inventory |
| Electrical contractors | Usually shaped by project staging and lead-time exposure |
| Auto repair shops | Can differ widely between routine maintenance parts and specialty components |
| Construction service and repair | Often lower when materials are purchased ahead of jobs |
| Managed facilities service | Frequently influenced by contract response requirements and stocked service kits |
That table is useful as a discussion starter. It is not a verdict.
Converting turns into days of inventory
Some owners understand turns immediately. Others find a time-based view more intuitive. That’s where Days Sales of Inventory, often shortened to DSI, can help.
The general idea is simple. DSI translates your turnover result into how long inventory tends to sit before being used or sold through. If your team thinks in schedules, lead times, and work orders, days can be easier to act on than a ratio.
For example, if inventory appears to sit for a long time, you may have too much cash tied up in stock. If it appears to move too fast, you may need stronger reorder planning.
Questions that matter more than the benchmark
When reviewing your ratio, ask these instead:
- Are stockouts hurting jobs or response times?
- Is inventory growing faster than the business?
- Are buyers ordering around old habits?
- Do you have dead stock from work you no longer pursue?
- Are high-value items moving slower than expected?
Those questions usually produce better decisions than chasing someone else’s benchmark.
Actionable Steps to Improve Your Inventory Turns
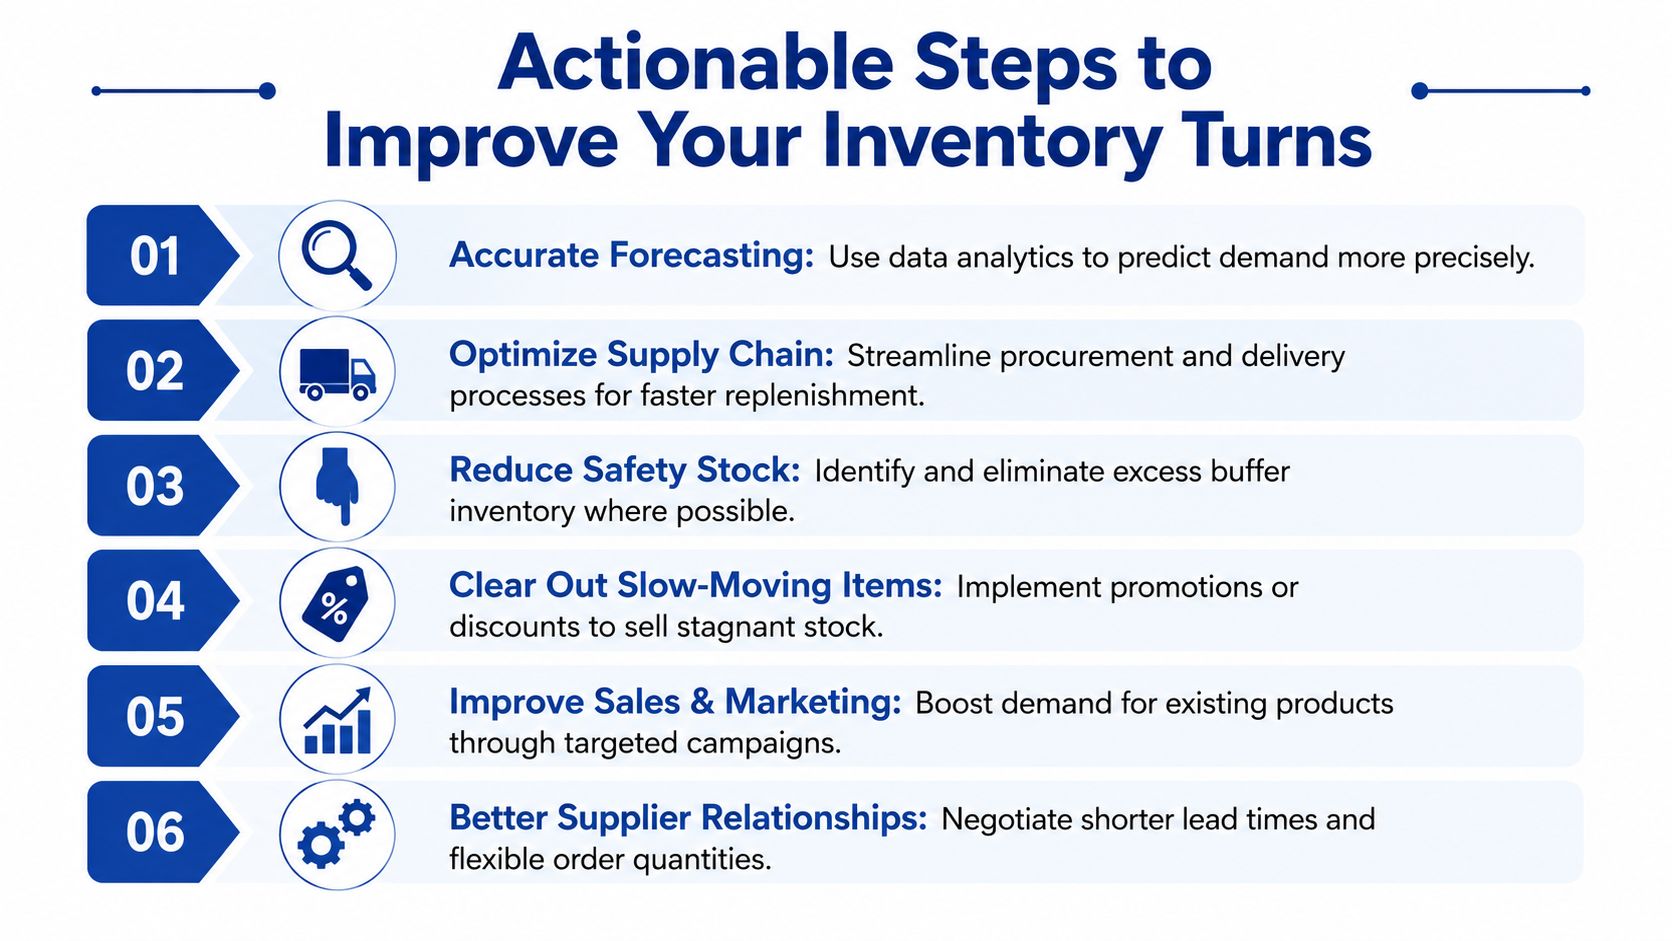
Improving inventory turns usually has less to do with heroic effort and more to do with routine discipline. Most service businesses don’t need a complex inventory platform to get better. They need clearer rules, better visibility, and fewer instinct-based purchasing decisions.
Start with the inventory you already have
Don’t begin by changing vendors. Start by reviewing what’s sitting on hand now.
Look for items that are obsolete, duplicated across locations, or tied to services you rarely provide anymore. Those items absorb cash and shelf space without helping current operations.
A straightforward first pass can include:
- Old service parts: Components linked to discontinued equipment types
- Project leftovers: Materials purchased for specific jobs but never reassigned
- Duplicate stock: The same item purchased under slightly different names or SKUs
- Slow movers: Items that remain untouched period after period
Tighten purchasing habits
The next improvement usually comes from buying behavior, not accounting.
Some businesses place large orders because bulk buying feels efficient. Sometimes it is. But often it loads the shelves with inventory that won’t move for a long time.
Try these changes:
- Order in smaller batches: That lowers the chance of overcommitting cash.
- Set reorder points intentionally: Don’t let habit decide what “low” means.
- Separate stock items from job-specific materials: They shouldn’t be purchased the same way.
- Review lead times with suppliers: Better lead-time clarity often reduces the urge to overstock.
If you want more outside ideas, these practical inventory management strategies can be a helpful supplement.
Better turns rarely come from buying less across the board. They come from buying with more precision.
Use data for safety stock, not guesswork
Safety stock is often necessary in service businesses. The mistake is treating every item like it needs the same buffer.
Some parts deserve protection because a stockout creates expensive downtime or a missed service promise. Others don’t.
Create a short review list:
- Which items are critical for response time?
- Which items have unreliable lead times?
- Which items are cheap to hold versus costly to miss?
- Which items almost never move but keep getting reordered?
That exercise helps you protect the right inventory instead of carrying too much of everything.
Forecast at a basic level
You don’t need advanced software to forecast better. A spreadsheet with item history, seasonality notes, and planned project demand is often enough to improve ordering.
For many owners, the win comes from replacing “we usually buy this much” with “we expect this level of usage based on recent work and upcoming jobs.”
That shift alone can improve inventory turns calculations because your purchases start matching reality more closely.
If you want help turning messy inventory data, QuickBooks reports, and month-end bookkeeping into decisions you can trust, Steingard Financial works with service businesses that need accurate reporting, cleaner systems, and better visibility into cash flow drivers like inventory.