 Skip to content

Your P&L says you had a strong month. Revenue looked healthy. Margins looked fine. Then payroll hit, a few client payments slipped, and your bank balance told a very different story.
That disconnect is where many B2B service owners get stuck. You can be profitable on paper and still feel cash pressure because accounting profit and spendable cash don’t move in lockstep. Accrual accounting recognizes revenue and expenses when earned or incurred. Cash moves when invoices are paid, payroll clears, software renewals hit, and equipment gets purchased.
If you’ve ever looked at QuickBooks and thought, “We made money, so why does cash feel tight?” you’re asking the right question. The better metric isn’t just profit. It’s unlevered free cash flow, a measure of what the business itself produces from operations after the reinvestment needed to keep it running, but before financing choices distort the picture.
Why Your Profit and Loss Statement Is Not Enough
A service business can look solid on the P&L and still create stress in real life.
Take a common situation. You finish the month with strong revenue, your team delivered the work, and your income statement shows a profit. But several big invoices were sent near month-end and won’t be collected until later. Meanwhile, payroll, contractor payments, benefits, and software subscriptions have already gone out. If you billed an annual project upfront, deferred revenue may also be sitting on the balance sheet, which further muddies the story.
The P&L isn’t wrong. It’s just answering a different question.
Profit answers performance. Cash answers survival.
Your income statement tells you whether the business earned an accounting profit over a period. It does not tell you how much cash the core operation generated after funding working capital needs and necessary reinvestment.
That’s why owners often need to reconcile accrual results to cash reality. If you want a clean explanation of that bridge, this guide to accrual to cash adjustment is useful background.
A profitable month can still drain cash if receivables rise, deferred revenue falls, or payroll accruals reverse.
For B2B service firms, this gap is often larger than owners expect. You may not buy much equipment, so it seems like cash flow should be straightforward. In practice, billing timing, prepaid retainers, reimbursable client costs, and payroll cutoffs can swing cash far more than your P&L suggests.
What owners usually miss
A few balance sheet movements create most of the confusion:
- Accounts receivable: You recorded revenue, but the client hasn’t paid yet.
- Deferred revenue: You collected cash, but accounting hasn’t recognized all of it as revenue yet.
- Accrued payroll and bonuses: The expense is recognized before cash leaves the bank.
- Pass-through costs: Client-related costs can temporarily inflate or depress working capital.
Unlevered free cash flow helps you see through that noise. It asks a cleaner question: after running the business and reinvesting what’s necessary, how much cash did the operation generate before interest, debt paydown, or owner distributions enter the picture?
That makes it useful not only for valuation, but also for practical decisions like hiring, bonus planning, and how much cushion your business needs.
What Unlevered Free Cash Flow Actually Measures
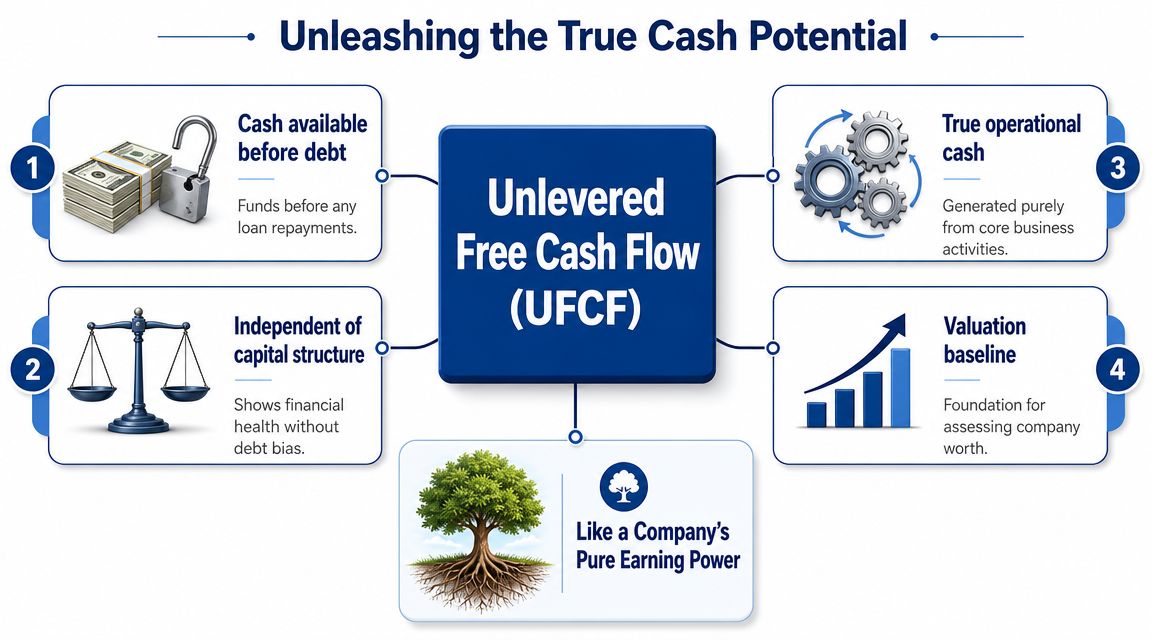
Unlevered free cash flow measures the cash produced by the business’s core operations before financing effects. It is also called free cash flow to the firm, or FCFF. Wall Street Prep describes it as cash generated by core operations before financing effects, typically calculated from EBIT or NOPAT and then adjusted for non-cash charges, working capital investment, and capital expenditures. It is commonly used in enterprise value DCF analysis because it isolates operating performance from capital structure effects, as explained in their overview of unlevered free cash flow.
Think of it like household earning power
A simple analogy helps.
Suppose you want to know how much cash a household generates from work after normal living costs and necessary upkeep, but before mortgage payments. You wouldn’t start with the mortgage because that reflects a financing choice. You’d first ask what the household itself can produce.
That’s what unlevered free cash flow does for a business. It looks at the company’s pure operating cash-generating ability before debt service changes the picture.
The standard formula
A common version is:
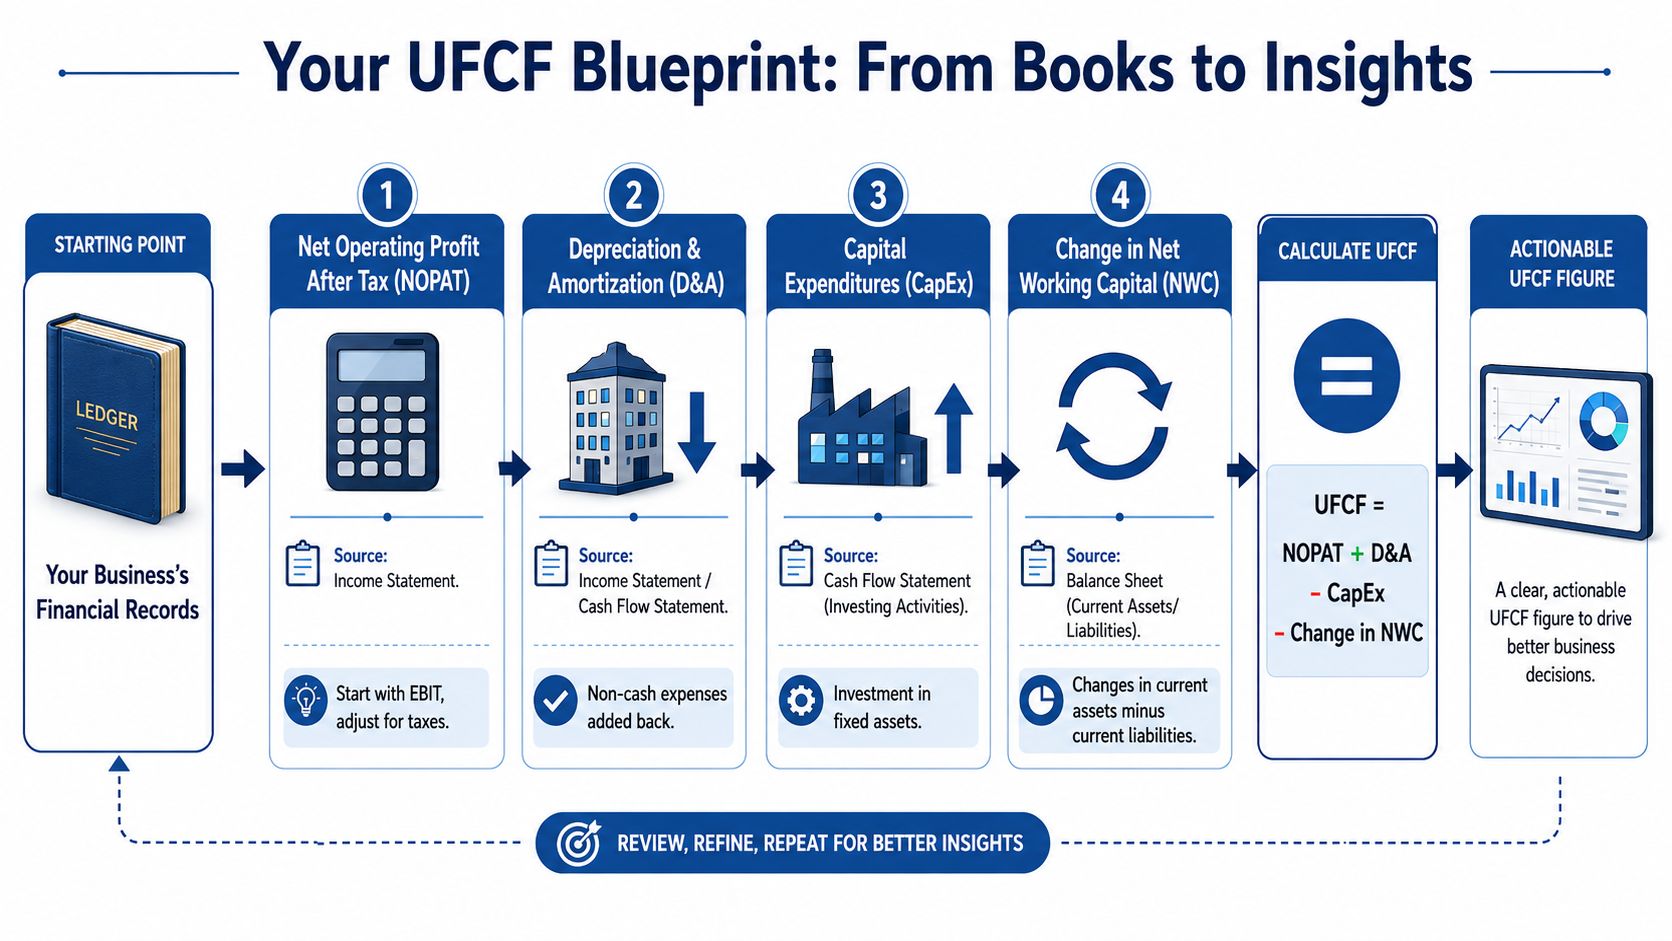
UFCF = EBIT × (1 − tax rate) + D&A − CapEx − change in net working capital
Each piece matters:
- EBIT: Earnings before interest and taxes. This strips out financing cost so you’re looking at operations.
- Tax-adjusted EBIT: Often called NOPAT. This estimates after-tax operating profit.
- D&A: Depreciation and amortization are non-cash expenses, so you add them back.
- CapEx: Capital expenditures are real cash outflows for long-term assets, so you subtract them.
- Change in net working capital: If receivables rise or prepaid expenses increase, cash is tied up. If payables or deferred revenue rise, they can provide operating cash.
Where people get tripped up
Owners often hear “free cash flow” and assume it means cash in the bank that’s safe to distribute. That’s not what UFCF means.
It is not:
- Cash after loan payments
- Cash after owner draws
- Cash after taxes paid under every entity structure
- The same as net income
- The same as operating cash flow
Practical rule: UFCF is an operating metric first. It asks how the business performs before your financing decisions enter the math.
For a service firm, this distinction matters because debt may be light, but billing practices can make operating cash look unusually strong or weak in a given month. UFCF gives you a disciplined framework to separate operating performance from financing and timing distortions.
How to Calculate Unlevered Free Cash Flow Step by Step
Let’s make this concrete with a simple fictional example. We’ll use Innovate Solutions Inc., a B2B service company with recurring client work, moderate software costs, payroll-heavy expenses, and light equipment purchases.
Assume you’ve pulled year-end numbers from QuickBooks and supporting schedules. The goal is not to create a perfect tax model. The goal is to calculate a clean operating cash flow figure that reflects what the business generated before financing.
Start with operating profit
Here is a sample calculation using simplified inputs.
| Line Item | Amount ($) | Note |
|---|---|---|
| EBIT | 500,000 | Operating profit before interest and taxes |
| Less estimated operating taxes | 125,000 | EBIT adjusted to after-tax operating profit |
| NOPAT | 375,000 | EBIT less taxes |
| Add back D&A | 40,000 | Non-cash expense |
| Less CapEx | 25,000 | Equipment and software implementation costs capitalized |
| Less increase in net working capital | 60,000 | Cash tied up in receivables and other operating accounts |
| Unlevered free cash flow | 330,000 | Cash from operations before financing effects |
A few things to notice. We started with EBIT, not net income. That’s important because interest expense belongs to financing, and UFCF is designed to exclude financing effects.
Then convert accounting profit into cash logic
The tax adjustment turns EBIT into an after-tax operating figure. Then you add back depreciation and amortization because those reduce accounting profit without using current-period cash.
CapEx comes out because buying long-term assets uses cash, even if the expense is recognized slowly over time. If you need a practical guide to identifying those purchases correctly, this walkthrough on how to calculate capital spending helps separate true CapEx from routine operating expenses.
Working capital is usually the swing factor
In many service companies, the hardest part isn’t EBIT or depreciation. It’s the change in working capital.
Suppose Innovate Solutions had:
- rising accounts receivable because large client invoices went out near year-end
- lower accrued payroll because a bonus accrual was paid
- a drop in deferred revenue because prepaid work was delivered this quarter
Those changes can pull cash out of the business even while the P&L looks healthy. In our example, that produced a use of cash through working capital, so we subtracted it.
When owners say, “Cash disappeared even though we had profit,” working capital is usually where the answer lives.
The takeaway from the example
Innovate Solutions reported healthy operating profit. But its unlevered free cash flow was lower because cash got absorbed by working capital and reinvestment.
That is exactly why UFCF matters. It doesn’t stop at earnings. It follows the money through the balance sheet and into the actual cash demands of operating the business.
Unlevered vs Levered Free Cash Flow What’s the Difference
These two metrics sound similar, but they answer different questions.
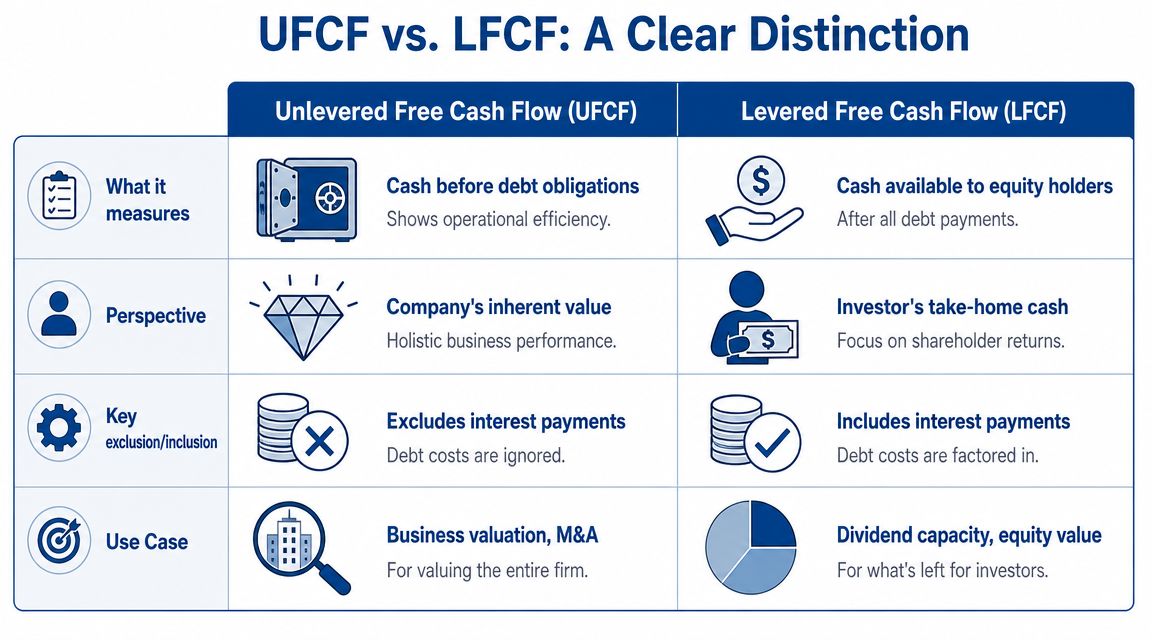
Unlevered free cash flow asks how much cash the business generates before debt-related payments affect the result. Levered free cash flow asks what’s left for equity owners after debt obligations are reflected.
That difference sounds technical. It isn’t. It’s the difference between valuing the business itself and measuring what remains for the owners after the financing stack takes its share.
Side-by-side comparison
| Topic | Unlevered free cash flow | Levered free cash flow |
|---|---|---|
| What it measures | Cash from operations before debt effects | Cash left for equity after debt-related obligations |
| Starting point | Operating profit, typically EBIT or NOPAT | Usually net income or post-financing cash flow |
| Interest expense | Excluded from the core measure | Reflected in the result |
| Best use | Valuing the whole company | Evaluating equity cash available to owners |
| Main audience | Buyers, investors, lenders, operators | Equity holders and owner-operators |
Which one should you use
If you’re comparing operating performance across companies, planning a sale process, or building a DCF around enterprise value, unlevered free cash flow is usually the cleaner tool.
If you’re asking, “After loans and financing obligations, how much cash is left for me as the owner?” levered free cash flow is closer to that answer.
Why owners mix them up
Most business owners live in levered reality. They care about the bank account after debt service, distributions, and taxes. That’s reasonable. It’s how the business feels day to day.
But valuation professionals often start with UFCF because two similar service firms can have very different debt structures. If you leave debt in the operating metric, you stop comparing the businesses and start comparing financing decisions.
UFCF tells you what the engine produces. LFCF tells you what reaches the driver’s seat after the lender takes a turn.
Both metrics are useful. You just don’t want to use one as a substitute for the other.
Finding UFCF Inputs in Your Service Business’s Books
The concept proves useful in practice. You don’t calculate unlevered free cash flow from theory. You pull it from your actual books, then clean up the inputs so timing noise doesn’t distort the answer.
If you want a visual walkthrough of cash flow reporting, this video is a helpful companion:
Where to pull each input
In QuickBooks Online, start with your standard reports:
- EBIT or operating profit: Pull your Profit and Loss. Start with operating income before interest and taxes. If your chart of accounts is messy, make sure interest income, interest expense, owner distributions, and unusual non-operating items are below the operating line.
- Depreciation and amortization: Find these on the Profit and Loss if they are booked monthly. If not, check your year-end journal entries or your accountant’s depreciation schedule.
- CapEx: Review the Balance Sheet asset additions and the Statement of Cash Flows investing section if available. Fixed asset purchases, furniture, equipment, leasehold improvements, and capitalized software implementation costs are typical places to check.
- Working capital accounts: Use comparative Balance Sheet reports for the start and end of the period.
For payroll data, systems like Gusto or QuickBooks Payroll help you verify accrued wages, payroll tax liabilities, bonuses, and benefits timing. Those details matter because payroll accruals often create big month-end swings in service businesses.
The service business problem with working capital
Textbook UFCF often breaks down in practice.
Allianz Trade notes that the standard formula can be misleading for service businesses when working capital is volatile because of deferred revenue, pass-through costs, or uneven billing cycles. In these businesses, small timing differences in working capital can dominate the calculation, so normalizing those figures is critical to avoid forecasting errors and reflect underlying operations more accurately, as discussed in their piece on unlevered free cash flow in practice.
Common problem areas include:
- Deferred revenue: Annual retainers or upfront implementation fees can make one period look cash-rich and the next look weak.
- Accrued payroll: A payroll cutoff near month-end may temporarily overstate or understate operating cash.
- Pass-through client costs: Reimbursable expenses can bloat receivables and payables without saying much about core economics.
- Uneven billing cycles: Milestone billing and delayed invoicing can create large AR swings.
How to normalize the inputs
Don’t just plug one month’s balance sheet changes into the formula and call it done. For a service business, that’s often a recipe for a misleading result.
Use a normalization approach:
- Look at trends, not snapshots. Review several periods of AR, deferred revenue, accrued payroll, and payables.
- Separate structural items from timing items. If deferred revenue is part of your normal model, forecast it as such. If a spike came from one unusual contract, isolate it.
- Strip out pass-through noise where possible. Client-reimbursable amounts can distort working capital without changing operating earning power.
- Tie payroll accruals to the payroll calendar. If the month closed mid-cycle, adjust so you’re comparing like with like.
If you also want the cash flow statement angle, this guide on how to find operating cash flow helps connect QuickBooks reports to the broader cash picture.
For owners who want the equity-side counterpart, Finzer offers useful insights from Finzer on LFCF, especially if you’re trying to understand what remains after financing costs rather than what the business generates before them.
Why UFCF Is Critical for Business Valuation
When buyers, investors, and advisors value a business, they’re not just looking at last month’s profit. They’re asking a bigger question: what cash can this company generate from its operations over time?
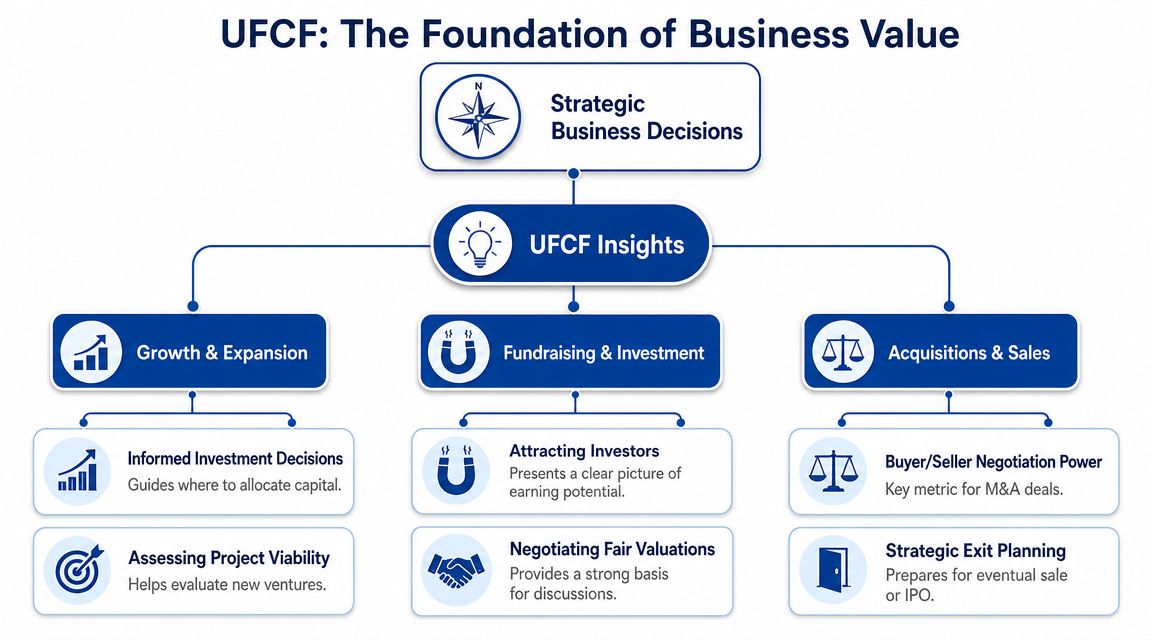
That’s why unlevered free cash flow matters so much. It is the standard input for enterprise-value DCF work because it isolates operating performance from capital structure effects, which is exactly why Wall Street Prep highlights it as the preferred measure in that context.
It supports better strategic decisions
Even if you aren’t selling the company, UFCF sharpens decision-making.
A few examples:
- Hiring plans: Can the business support additional delivery or sales talent from operating cash?
- Expansion bets: Are you funding growth from real operating strength or from favorable billing timing?
- Debt decisions: If cash generation is strong before financing, you can evaluate borrowing with a clearer baseline.
- Exit preparation: Buyers will examine how much of your reported performance converts into normalized operating cash.
It changes the negotiation
A clean UFCF model gives you a stronger footing in valuation conversations because it shows the earning power of the operation itself. That’s useful in M&A, investor discussions, and internal planning.
If you want a rough outside-in check alongside your internal cash flow analysis, tools that help you understand your business’s market value can provide context before you move into a full valuation exercise.
Strong valuation work starts with clean books, then clean adjustments. UFCF sits right in the middle of that process.
For service businesses, this is especially important because small working capital timing quirks can distort value if no one normalizes them. A business isn’t worth more just because year-end billing happened to land before payroll. And it isn’t worth less because deferred revenue unwound during a heavy delivery month.
When you understand unlevered free cash flow, you stop relying on a single profit number to tell the whole story. You begin to see the business the way a serious buyer, lender, or CFO would see it.
If you want help turning QuickBooks and payroll data into reliable cash flow reporting, Steingard Financial helps service businesses clean up their books, map the right accounts, and build reporting you can use for decisions, forecasting, and valuation.