
Your books probably looked fine when the business was smaller. You bought materials, paid payroll, sent invoices, and reviewed a standard profit and loss statement. Then production grew. Suddenly you had parts sitting on shelves, half-finished jobs on the floor, supervisors splitting time across departments, and month-end numbers that didn't seem to match what operations was seeing.
That's the point where ordinary bookkeeping stops being enough. A manufacturer doesn't just buy and sell. A manufacturer transforms inventory into something more valuable, and the accounting system has to track that change with discipline. If it doesn't, pricing gets shaky, margins get distorted, and leadership starts making decisions from incomplete information.
Good accounting for manufacturing isn't only about compliance. It's the backbone of a practical back office. It shapes how you set up QuickBooks, how you close the books each month, which KPIs you trust, and how payroll and HR data feed cost reporting.
Why Accounting for Manufacturing Is Different
A service business usually asks a simpler accounting question. What did we earn, and what did it cost to deliver that work?
A manufacturer has to answer a harder one. What is the value of this product at each stage of production? Raw materials have one value. Partially assembled goods have another. Finished goods have another. The business is creating value before the customer ever receives a shipment, and the books have to track that movement accurately.
That's why accounting for manufacturing needs its own structure. You're not just categorizing expenses. You're tracing costs through raw materials, direct labor, manufacturing overhead, work in process, finished goods, and cost of goods sold.
The size of the sector shows why this matters. In 2023, U.S. manufacturing accounted for 10.70% of total national output, contributed $2.5 trillion to the economy, and employed 8.41% of the workforce. The same source projects a $7.1 trillion U.S. manufacturing market size in 2024. That scale is one reason manufacturers need accounting systems that can handle materials, labor, overhead, inventory, and variances with more precision than a typical service company setup, as noted in this manufacturing accounting overview.
Where owners usually get stuck
Three trouble spots show up again and again:
- Inventory isn't broken into stages. Raw materials, work in process, and finished goods get lumped together.
- Labor is treated too broadly. Shop labor, setup time, and indirect support work all hit payroll expense without being assigned properly.
- Overhead gets guessed at. Rent, utilities, equipment costs, and plant supervision are real production costs, but many systems don't absorb them consistently.
The fastest way to lose trust in your financials is to let operations run one system and accounting run another.
A solid setup fixes that. It starts with understanding what belongs in product cost.
Understanding Your True Cost of Goods Sold
If you make cabinets, the cost of one cabinet isn't just wood and hinges. It also includes the wages of the person building it and a share of the factory costs that made production possible.
That's the core of accounting for manufacturing. True cost of goods sold includes three buckets.
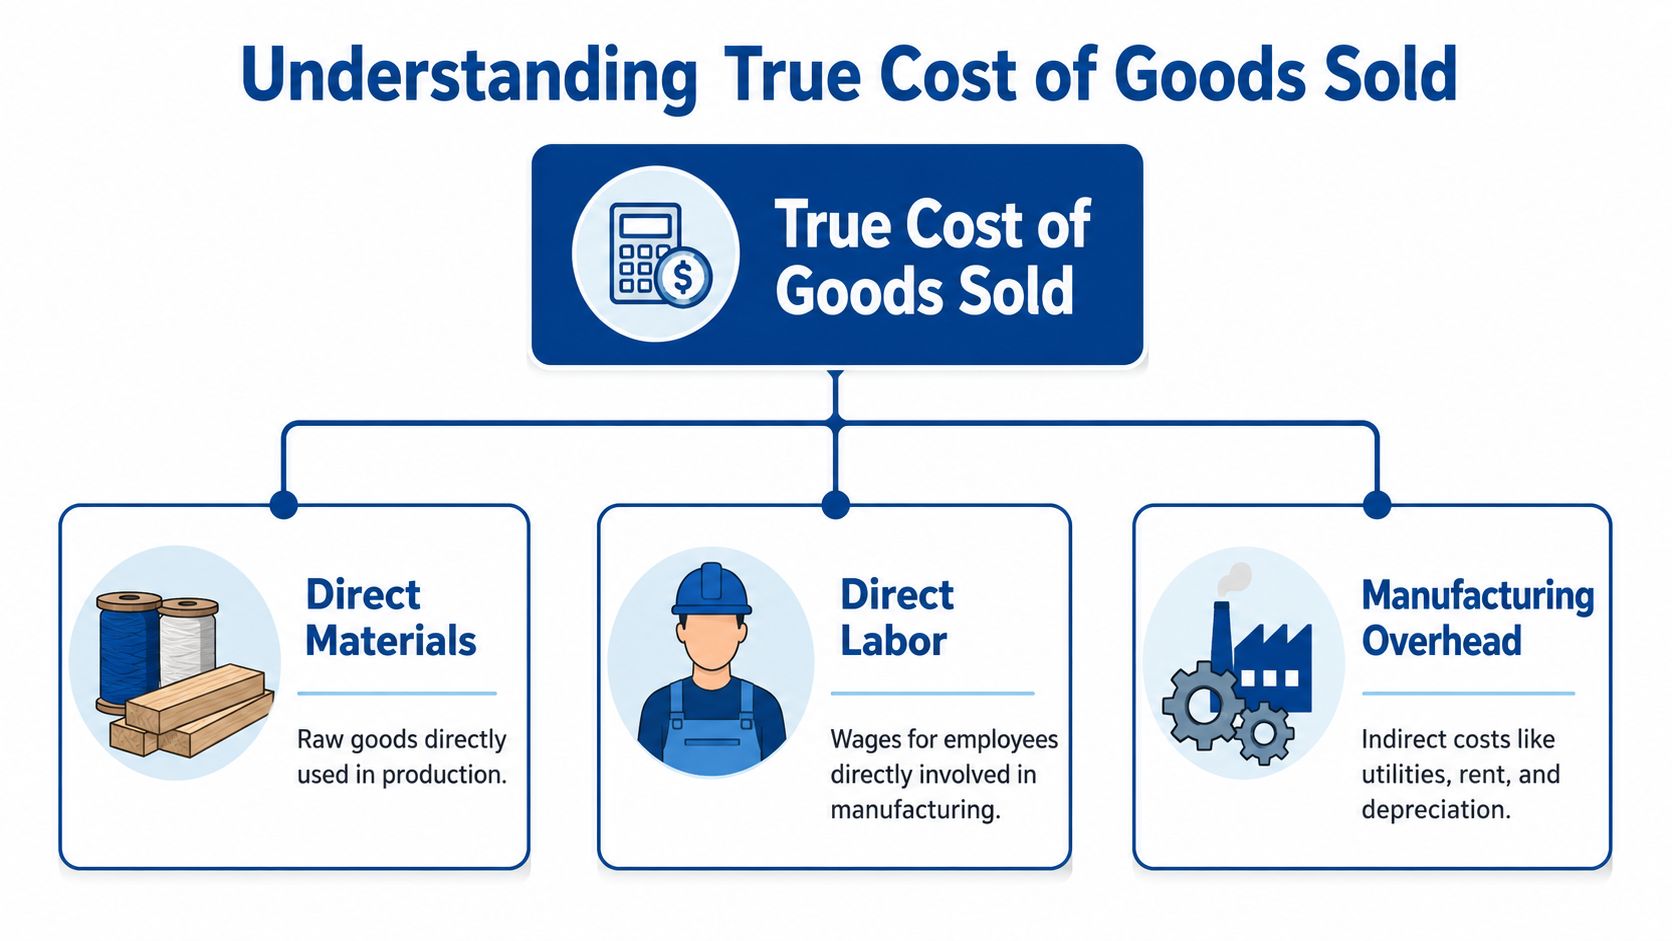
The three cost layers
Think about baking bread in a commercial kitchen.
- Direct materials are the flour, yeast, salt, and packaging. In manufacturing, these are the raw inputs physically traceable to the product.
- Direct labor is the baker's time mixing, shaping, and baking. In a factory, that's the labor directly involved in making the item.
- Manufacturing overhead is the kitchen rent, electricity, mixer maintenance, production software, and shift supervision. These costs support production, but you usually can't trace them to one loaf directly.
A lot of owners understand the first two but undercount the third. That's where margins often look better on paper than they really are.
Why a bill of materials matters
Your bill of materials, or BOM, is the recipe. It lists what components go into one unit of product. If you make a control panel, the BOM might include the enclosure, wiring, switches, labels, and fasteners.
Without a BOM, purchasing can still buy parts and production can still build product. But accounting can't reliably answer basic questions like:
- Which products consume the most expensive components?
- Which item is profitable only because overhead is missing?
- What should one completed unit cost?
For businesses trying to tighten margins, it also helps to connect labor strategy to product cost. This discussion from PEO Metrics on reducing COGS is useful because it frames cost of goods sold as an operating system issue, not just an accounting label.
Work in process is where confusion starts
Work in process, or WIP, is the value of partially completed goods. At this stage, many small manufacturers lose visibility. Materials have been issued. Labor has been spent. Overhead is accumulating. But the product isn't finished, so it shouldn't be in finished goods, and it shouldn't be expensed as sold either.
Practical rule: If a product is on the floor and not ready for sale, it usually belongs in WIP, not in finished goods and not in a miscellaneous expense account.
A grocery store offers a simple analogy. Milk in the cooler is inventory ready to sell. But if the store had a deli kitchen turning ingredients into prepared meals, the chopped vegetables and partially assembled trays would be WIP. They have value, but they aren't sale-ready yet.
That's why your chart of accounts and item setup matter so much. If you want a more general primer on the accounting side of this concept, Steingard's guide to what cost of goods sold means gives a useful baseline.
Building Your Financial Blueprint in QuickBooks
Most QuickBooks files don't fail because the software is bad. They fail because they're set up like a generic small business, not like a manufacturer.

If your chart of accounts has one inventory account, one payroll expense account, and one broad cost of goods sold account, you'll get financial statements. You just won't get useful ones.
What a manufacturing chart of accounts needs
At a minimum, a manufacturer usually needs separate visibility into these areas:
| Account area | Example accounts |
|---|---|
| Current assets | Raw Materials Inventory, Work in Process Inventory, Finished Goods Inventory |
| Cost of goods sold | Direct Materials Used, Direct Labor, Applied Overhead, Purchase Price Variance, Scrap or Rework |
| Operating expenses | Sales Salaries, Office Payroll, Administrative Rent, Software, Professional Fees |
| Liabilities | Accrued Payroll, Sales Tax Payable, Customer Deposits |
| Equity | Owner Equity, Retained Earnings |
That structure does two jobs. First, it keeps the balance sheet honest by separating what you own at each production stage. Second, it makes the income statement useful for pricing and margin analysis.
How to set this up in QuickBooks
QuickBooks Online can support a basic manufacturing back office if you're disciplined about structure.
Start with the chart of accounts. Create separate inventory and COGS accounts instead of lumping everything together. Then decide how you'll track products. Some businesses use inventory items plus assemblies in a connected app. Others use classes, locations, or custom fields to track departments or product families.
A workable implementation usually follows this order:
- Clean the chart of accounts first. Don't build reports on a messy foundation.
- Map inventory stages clearly. Raw materials, WIP, and finished goods should not share one account.
- Separate direct and indirect payroll. Production wages shouldn't disappear into one payroll bucket with office salaries.
- Choose an overhead policy. Decide how you'll apply factory overhead each month and stick with it.
- Tie forms to operations. Purchase orders, bills, time entries, and inventory adjustments need consistent coding rules.
If you're refining the structure, this guide on how to create a chart of accounts is a good companion to the setup work.
Keep QuickBooks honest with process, not hope
QuickBooks won't infer manufacturing logic on its own. Your team has to create it.
For example, when purchasing buys steel, that should land in raw materials. When production issues that steel to a job, the value should move to WIP. When the product is completed, it should move to finished goods. When shipped and recognized as sold, it should become cost of goods sold. If any one of those steps is skipped, the financials drift.
This walkthrough is a useful visual refresher on structuring the system for reporting:
For growing manufacturers, that's often the moment to bring in outside help. A bookkeeping and payroll firm such as Steingard Financial can support QuickBooks setup, reporting design, payroll mapping, and recurring close discipline when internal staff is stretched.
Valuing Your Inventory FIFO LIFO and Average Cost
Inventory costing sounds technical until you put it in a grocery store.
A store receives milk every week. Older cartons arrived at a lower cost. Newer cartons arrived at a higher cost. When the store sells milk, which cost should accounting treat as sold first? That answer changes reported cost of goods sold and ending inventory.
Manufacturers face the same issue with metal, resin, electronics, lumber, and packaging.
The three methods in plain English
- FIFO means first in, first out. The oldest inventory costs move to cost of goods sold first.
- LIFO means last in, first out. The newest inventory costs move out first.
- Weighted-average cost blends available costs into one average unit cost.
In periods of rising input prices, these methods don't tell the same story.
Impact of Inventory Costing Methods During Inflation
| Metric | FIFO (First-In, First-Out) | LIFO (Last-In, First-Out) | Weighted-Average Cost |
|---|---|---|---|
| Cost of goods sold | Usually lower because older, cheaper costs flow out first | Usually higher because newer, more expensive costs flow out first | Usually falls between FIFO and LIFO |
| Gross profit | Usually higher | Usually lower | Usually in the middle |
| Ending inventory value | Usually higher because newer costs remain on the balance sheet | Usually lower because older costs remain on the balance sheet | Usually in the middle |
| Operational feel | Often matches physical flow for many businesses | May not match physical movement of goods | Smooths price swings |
| Management tradeoff | Stronger reported margins, higher inventory value | More conservative margin picture in rising costs | Simpler and steadier for internal reporting |
What owners should focus on
Don't choose a method just because someone said it's standard. Choose one that fits how you manage the business and how you want the financials to reflect cost movement.
If operations is dealing with rapidly changing material prices, a costing method that smooths or delays those changes can affect pricing decisions more than owners expect.
The main point is consistency. Once your books, pricing process, and KPI dashboard are built around one cost flow assumption, changing methods creates noise. It can also make trend reporting harder to interpret.
For many smaller manufacturers in QuickBooks, average cost is often easier to live with operationally. FIFO can also be intuitive. What matters is that the method aligns with your inventory process, reporting needs, and tax guidance from your CPA.
Your Monthly Guide to Closing the Books
Month-end close in a manufacturing company isn't just reconciling the bank and booking payroll. It's a controlled review of inventory, production, labor, and overhead.
If the close is rushed, the business may report profit that hasn't been earned yet, miss costs sitting in WIP, or bury variances in broad expense accounts.
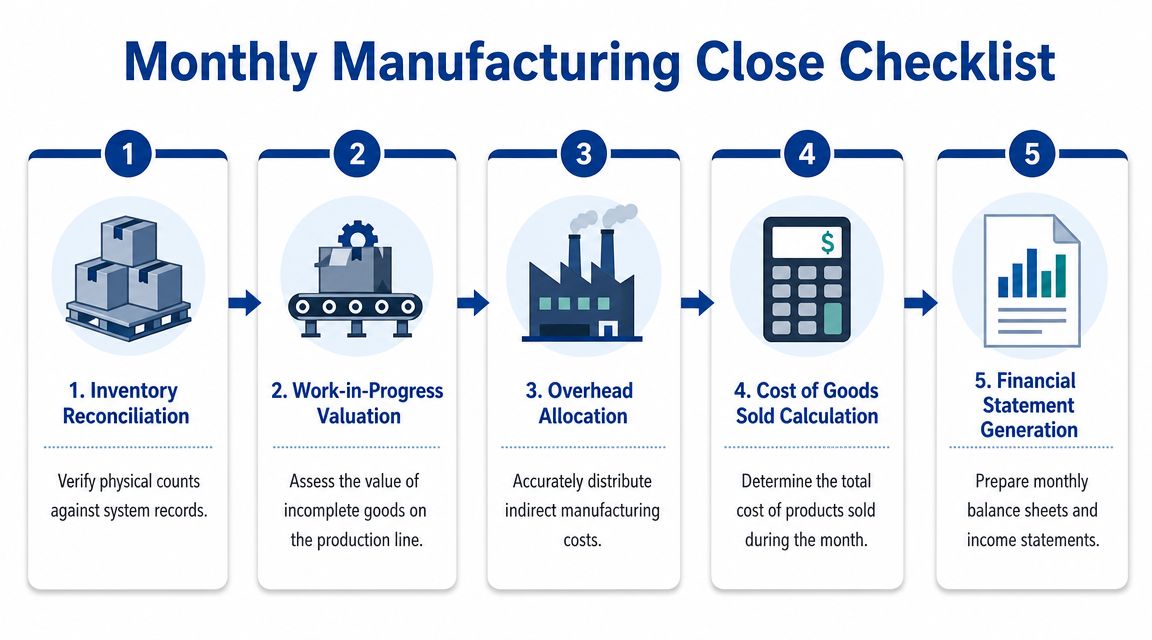
A practical month-end sequence
A reliable monthly close usually follows this order:
Reconcile inventory activity
Match purchases, receipts, production issues, and shipments to what the system shows.Review physical counts and adjustments
Spot-check key items. Investigate shrinkage, damage, or mis-picks instead of forcing a plug entry.Value WIP carefully
Confirm what jobs are still open, what stage they're in, and what materials and labor have been applied.Record payroll and labor allocation
Split direct production labor from indirect plant labor before finalizing COGS and overhead.Apply and true up overhead
Compare applied overhead to actual plant costs and book the difference with a clear policy.Finalize cost of goods sold
Make sure completed items moved out of inventory correctly and sales matched the right cost layer.
Where overhead trips people up
Many mainstream articles barely address what to do when manufacturing overhead is underapplied or overapplied. That gap matters because the accounting choice changes reported margin and inventory values.
Educational guidance notes that underapplied overhead can be closed fully to cost of goods sold or allocated across work in process, finished goods, and cost of goods sold. The decision matters even more when input costs move around. The U.S. Bureau of Labor Statistics reported that the Producer Price Index for final demand rose 0.1% in April 2026, which reinforces how quickly absorption assumptions can shift in a volatile cost environment, as discussed in this overhead allocation explanation.
Here's the practical difference:
| Method | What it does | When owners often use it |
|---|---|---|
| Close to COGS | Pushes the full variance into the current period income statement | When the variance is small or speed matters more than precision |
| Prorate across WIP, finished goods, and COGS | Spreads the variance to where the costs are still sitting | When inventory is material and management wants cleaner product margins |
The close should answer operational questions
A good close doesn't stop at journal entries. It should help you answer questions like:
- Did margin fall because material costs changed, or because labor efficiency slipped?
- Is too much cash tied up in WIP?
- Did overtime drive direct labor up, or was the issue poor scheduling?
- Are we carrying finished goods that don't move?
Clean closes create faster decisions. Sloppy closes create meetings about whose numbers are right.
If your controller or outside bookkeeper can't explain the movement in inventory, WIP, and overhead in plain language, the close isn't finished.
Key Reports and KPIs for Smart Decisions
Financial statements tell you what happened. KPIs help you decide what to do next.
A manufacturer can show a decent monthly profit and still have trouble underneath the surface. Inventory may be building in the wrong products. Labor may be rising on one line. Capacity may be constrained in the department that drives shipments.
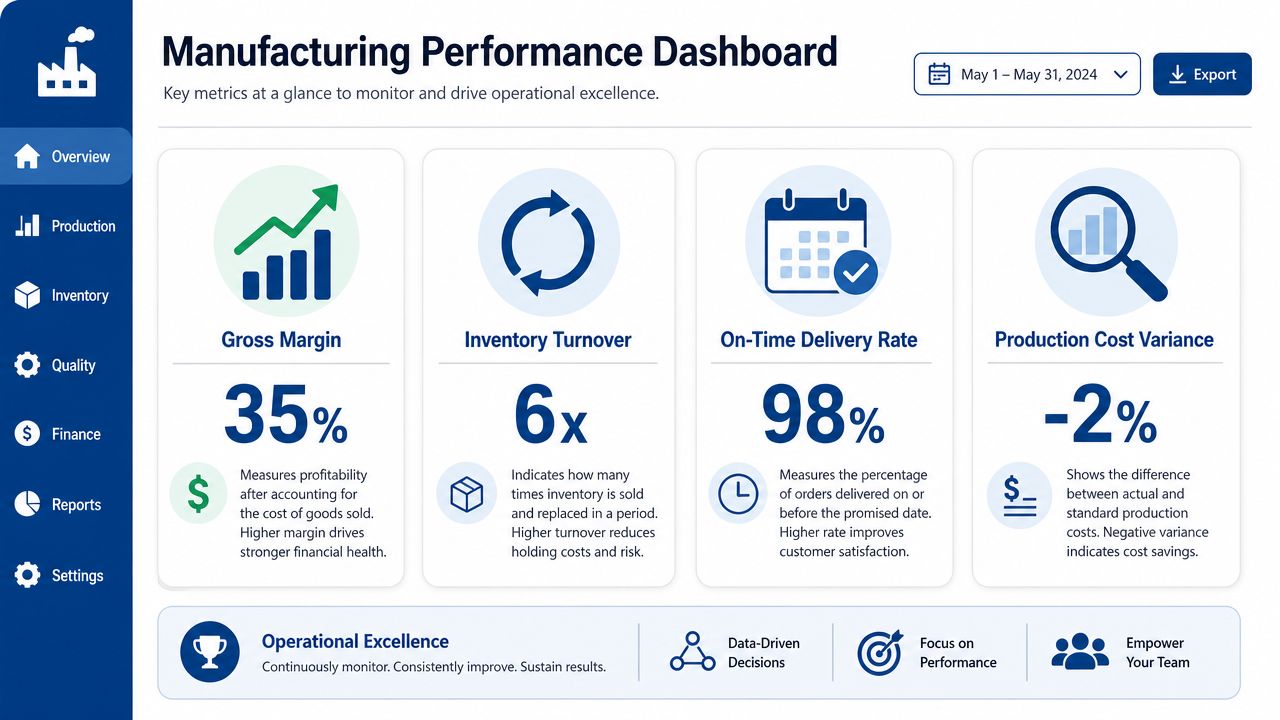
Four KPIs that connect accounting to operations
Gross margin by product or product family
This tells you which items are carrying the business and which ones are subtly underpriced.
Use sales minus the full product cost tied to those items. If your chart of accounts separates materials, labor, and applied overhead well, this report becomes far more credible. If all costs are pooled too broadly, the result looks precise but isn't.
Inventory turnover
This shows how quickly inventory is being sold and replaced. Slow turns can mean cash is trapped in the wrong stock, planning is off, or finished goods are ahead of demand.
If you want the accounting formula and interpretation, Steingard's article on inventory turns calculations is a useful reference.
Cost per unit
This is one of the simplest and most powerful reports in accounting for manufacturing. It pulls together direct materials, direct labor, and overhead into a per-unit view that pricing decisions can use.
Watch trends, not just one month. A stable sales price with a creeping unit cost is one of the earliest warnings that margin pressure is building.
Capacity utilization
This tells you how much of your available production capacity you're using. Finance teams sometimes ignore it because it feels operational, but it affects labor planning, overhead absorption, quoting, and lead times.
Pair financial KPIs with shop-floor visibility
Accounting data gets stronger when it meets machine and production data. If you're trying to connect throughput, downtime, and utilization to costs, a specialized resource for manufacturing professionals can help you think through machine-monitoring inputs that belong next to financial reporting.
A dashboard is useful only when the owner can trace each number back to a real process. If no one knows where the KPI comes from, it becomes wall art.
What a monthly dashboard should include
A practical dashboard usually includes:
- Margin view with product, customer, or job-level profitability
- Inventory view showing raw materials, WIP, finished goods, and slow-moving stock
- Labor view separating direct time, indirect time, and overtime trends
- Operations view with utilization, schedule adherence, or delivery reliability
- Variance view comparing expected cost to actual cost
The best KPI set isn't the biggest one. It's the smallest set that helps leadership notice changes early and act confidently.
Integrating People and Production Finance
Manufacturing payroll is more than cutting checks. It feeds product cost.
If payroll is mapped poorly, your books can't tell the difference between a machine operator building product, a maintenance technician supporting the plant, and an office employee handling administration. Those are all labor costs, but they don't belong in the same place.
Labor coding affects inventory and margin
Direct labor should usually flow into production cost. Indirect plant labor often belongs in manufacturing overhead. Administrative payroll belongs below gross profit in operating expenses.
That sounds straightforward until real life gets involved. A supervisor spends part of the week on line support and part on scheduling. Overtime spikes during a rush order. Training hours hit early in the month. Benefits and payroll taxes need a consistent allocation approach too.
A workable back office usually needs:
- Time categories that match accounting logic
- Payroll mapping that separates direct and indirect labor
- Department or class tracking for production support roles
- A review process for overtime, bonuses, and shift differentials
Modern tools like Gusto and QuickBooks Payroll can help streamline collection and coding, but software alone won't create a labor-cost policy.
HR decisions change your cost structure
Many owners overlook this connection. People decisions are finance decisions.
If retention is weak, labor efficiency may drop because you're constantly training replacements. If staffing plans are thin, overtime can distort direct labor cost. If compensation bands are inconsistent, forecasting gets muddy. If onboarding is informal, time tracking quality often suffers right away.
That's why integrated People Advisory has real value in manufacturing finance. Hiring plans, role design, compensation frameworks, and retention practices all affect the reliability of your product costing.
When outsourcing starts to make sense
A growing manufacturer should think about outside support when any of these are true:
- The owner is the reporting system. Everyone waits for one person to explain the numbers.
- Payroll and inventory don't tie cleanly. Labor cost gets booked, but not assigned meaningfully.
- Month-end keeps slipping. The team is closing late and still unsure about WIP or overhead.
- HR and finance are disconnected. Staffing changes happen without cost visibility.
Outsourcing bookkeeping and payroll to a specialist doesn't replace management. It gives management cleaner inputs. That's often the difference between reacting after the month is over and seeing problems while there's still time to fix them.
Common Questions About Manufacturing Accounting
How should I account for scrap and spoilage
Start by separating normal scrap from abnormal losses. Normal scrap is part of running the process and usually gets absorbed into production cost. Abnormal spoilage should be identified clearly so management can see the issue instead of hiding it inside standard product margins.
Keep the operational tracking simple. Record what was scrapped, where it happened, and whether it was expected. If scrap has resale value, account for that consistently too.
What's the difference between job costing and process costing
Job costing fits custom or batch work. You track materials, labor, and overhead by job, order, or project. This is common when products differ by customer specification.
Process costing fits more standardized production. Costs are accumulated by department or process over a period, then averaged across units. If your production flows continuously and products are similar, this approach is often more practical.
Does revenue always get recognized when the product ships
No. This is one of the most overlooked issues in accounting for manufacturing.
Many basic guides focus on finished-goods inventory, but under ASC 606, manufacturers must evaluate contract terms for custom goods. If goods have no alternative use and there's a right to payment for work completed, revenue may be recognized over time rather than only at shipment, which can pull revenue forward and make WIP metrics more important than shipment volume, as explained in this ASC 606 discussion for manufacturers.
That means custom production contracts need accounting review before the job is underway, not after the invoice goes out.
When should I move beyond QuickBooks
QuickBooks can work for many smaller manufacturers if the file is clean, the chart of accounts is well designed, and someone is actively managing inventory, payroll mapping, and close procedures.
You should start evaluating a manufacturing ERP when product structures, shop routing, inventory movement, or reporting needs become too complex to manage with manual workarounds. A good rule is this: if your team is exporting data every month just to rebuild the truth in spreadsheets, the system may no longer fit the business.
If your manufacturing back office feels patched together, Steingard Financial can help you design a cleaner system around bookkeeping, payroll, reporting, and people operations so your numbers support better decisions instead of creating more questions.