
Your revenue is up. Your team is busy. Clients are paying good rates. But payroll still feels tight, owner distributions feel unpredictable, and your bank balance never seems to match the story your sales numbers are telling.
That’s where many service business owners get stuck.
A consulting firm can bill out a strong month and still feel squeezed. A marketing agency can land new retainers and still wonder why profit doesn’t seem to show up. A bookkeeping practice can be fully booked and still feel like it’s working too hard for too little. Revenue tells you that activity happened. It doesn’t tell you whether that activity created a healthy business.
Profitability ratios answer that question.
They strip the drama out of the month and let you see what your business is keeping, where costs are drifting, and whether the structure of the company is getting stronger or weaker. If you run a labor-heavy business with low inventory and a lot of payroll, contractor expense, software spend, and client delivery pressure, these ratios matter even more. They translate accounting reports into decisions.
Beyond Revenue The True Story of Your Business’s Health
It’s Friday afternoon at a marketing agency. The team shipped client work all week, invoices went out, and the sales report looks strong. Then the owner checks the bank balance and hesitates. If revenue was solid, why does cash still feel tight?
That question comes up all the time in service businesses because revenue shows volume, not quality. A consulting firm can add billable hours while margins shrink because senior staff spent too much time on underpriced work. An IT services company can post a profitable month on paper while cash stays strained because receivables are slow. A bookkeeping firm can stay fully booked and still earn less than expected because payroll, software, and cleanup work eroded the gain.
Profitability ratios help you separate activity from performance.
They answer a more useful question than “How much did we sell?” They ask, “After paying the people, contractors, software vendors, and overhead required to serve clients, what are we keeping?” For a labor-heavy business with little or no inventory, that distinction matters fast. One pricing mistake, one bloated payroll layer, or one batch of scope creep can change the economics of the month.
A good way to view these ratios is as a set of x-rays for your income statement and balance sheet. Revenue is the outside appearance. Profitability ratios show whether the structure underneath is healthy.
For service firms, that structure usually depends on a few moving parts. Team utilization. Labor mix. Contractor dependence. Software subscriptions. Manager overhead. Client pricing discipline. If those numbers are recorded inconsistently, the ratios you calculate later will be shaky too. Clean bookkeeping is what makes the ratios trustworthy enough to guide decisions.
That is why owners who know their profitability ratios usually make better operating calls. They can spot whether a client relationship is profitable, whether hiring another account manager makes sense, or whether a rise in revenue is creating owner income. If you need a refresher on the building block behind several of these measures, this guide on how to calculate gross profit margin is a useful starting point.
The same idea shows up outside accounting. In ecommerce, big top-line figures can look impressive while the underlying economics stay weak. HiveHQ makes that point well in its article explaining why GMV is a vanity metric. Service businesses run into the same trap when they celebrate revenue without checking what that revenue produced.
What Are Profitability Ratios and Why Do They Matter
A consulting firm can post a record month in billings and still end up with less owner profit than the month before. That happens all the time in service businesses. More contractor hours, too much unbilled rework, rising software costs, or a weaker labor mix can eat through growth before you notice it.

What are profitability ratios? They are measurements that show how efficiently your business turns revenue and invested resources into profit. For a service business, they answer practical questions. Are your client engagements priced well? Is payroll producing enough return? Is growth creating profit, or just creating more work?
Profitability ratios matter because revenue alone leaves out context. A marketing agency that grows from $150,000 to $180,000 in monthly revenue may look stronger on the surface. If delivery payroll, freelancer spend, and overhead rise even faster, the business is becoming less efficient. Ratios correct for that by turning raw dollars into percentages and returns you can compare over time.
The two families of ratios
Most profitability ratios fall into two groups.
The first group is margin ratios. These measure how much of each sales dollar remains after a specific layer of cost. In a service firm, that usually means tracking what is left after direct labor, contractor costs, overhead, and finally all expenses. If you have ever asked, “We billed more this quarter, so why does cash still feel tight?” margin ratios usually help answer it.
The second group is return ratios. These measure profit against the resources tied up in the business, such as cash, receivables, equipment, software systems, and owner equity. If margin ratios show what you keep from revenue, return ratios show how hard your business assets and capital are working.
If you want a clearer foundation for the balance sheet side of those return measures, this guide on how to read a balance sheet helps connect the ratios to the accounts underneath them.
Why ratios are more useful than raw dollar amounts
Dollar amounts are important, but they are hard to compare on their own. Ratios standardize performance.
That matters even more in service businesses because the cost structure is different from product-based companies. You usually are not managing large inventories. You are managing people, time, utilization, write-offs, subcontractors, and overhead. A 10 percent increase in revenue means very little unless you also know what happened to delivery costs and operating expenses.
The three measures owners check most often are gross margin, operating margin, and net margin. Each one gives a different reading on the same business. Gross margin focuses on service delivery economics. Operating margin shows whether overhead is in line. Net margin shows what remains after everything is counted.
If you're working on better reporting, cleaner dashboards, or transforming financial data into decisions your leadership team can use, profitability ratios are often the starting point. They give owners, bookkeepers, controllers, and advisors a shared way to discuss performance without guessing.
What they help you decide
Used well, these ratios support day-to-day decisions, not just year-end review.
- Pricing: Are your fees covering labor and contractor costs with enough room left over?
- Hiring: Can current margins support another account manager, strategist, or project lead?
- Expense control: Are software, admin payroll, and other overhead costs growing faster than the firm can support?
- Client selection: Are certain accounts producing revenue but very little profit because of scope creep or inefficient delivery?
- Growth planning: Is added revenue improving owner income, or only increasing complexity?
These ratios are only as reliable as the bookkeeping behind them. If direct labor is mixed into overhead, contractor costs are posted inconsistently, or owner draws are misclassified, the percentages can point you in the wrong direction. Accurate books make profitability ratios useful enough to guide decisions with confidence.
Your Key Margin Ratios A Deep Dive
A consulting firm can finish a month with strong sales and still feel strangely tight on cash. An agency can sign new clients, stay busy, and watch owner profit barely move. That usually means revenue is not the problem. Cost structure is.
Margin ratios help you locate the pressure point.
For service businesses, that matters quickly because the biggest costs are usually people, contractor support, and the systems used to deliver client work. There is rarely much inventory to sort through. The core question is simpler and harder at the same time. Are your fees high enough, and are your delivery and overhead costs organized well enough, to leave a healthy profit?
The four ratios owners ask about most
These four margins answer different questions. Read them in order, from the top of the income statement down.
| Ratio Name | Formula | What It Tells You |
|---|---|---|
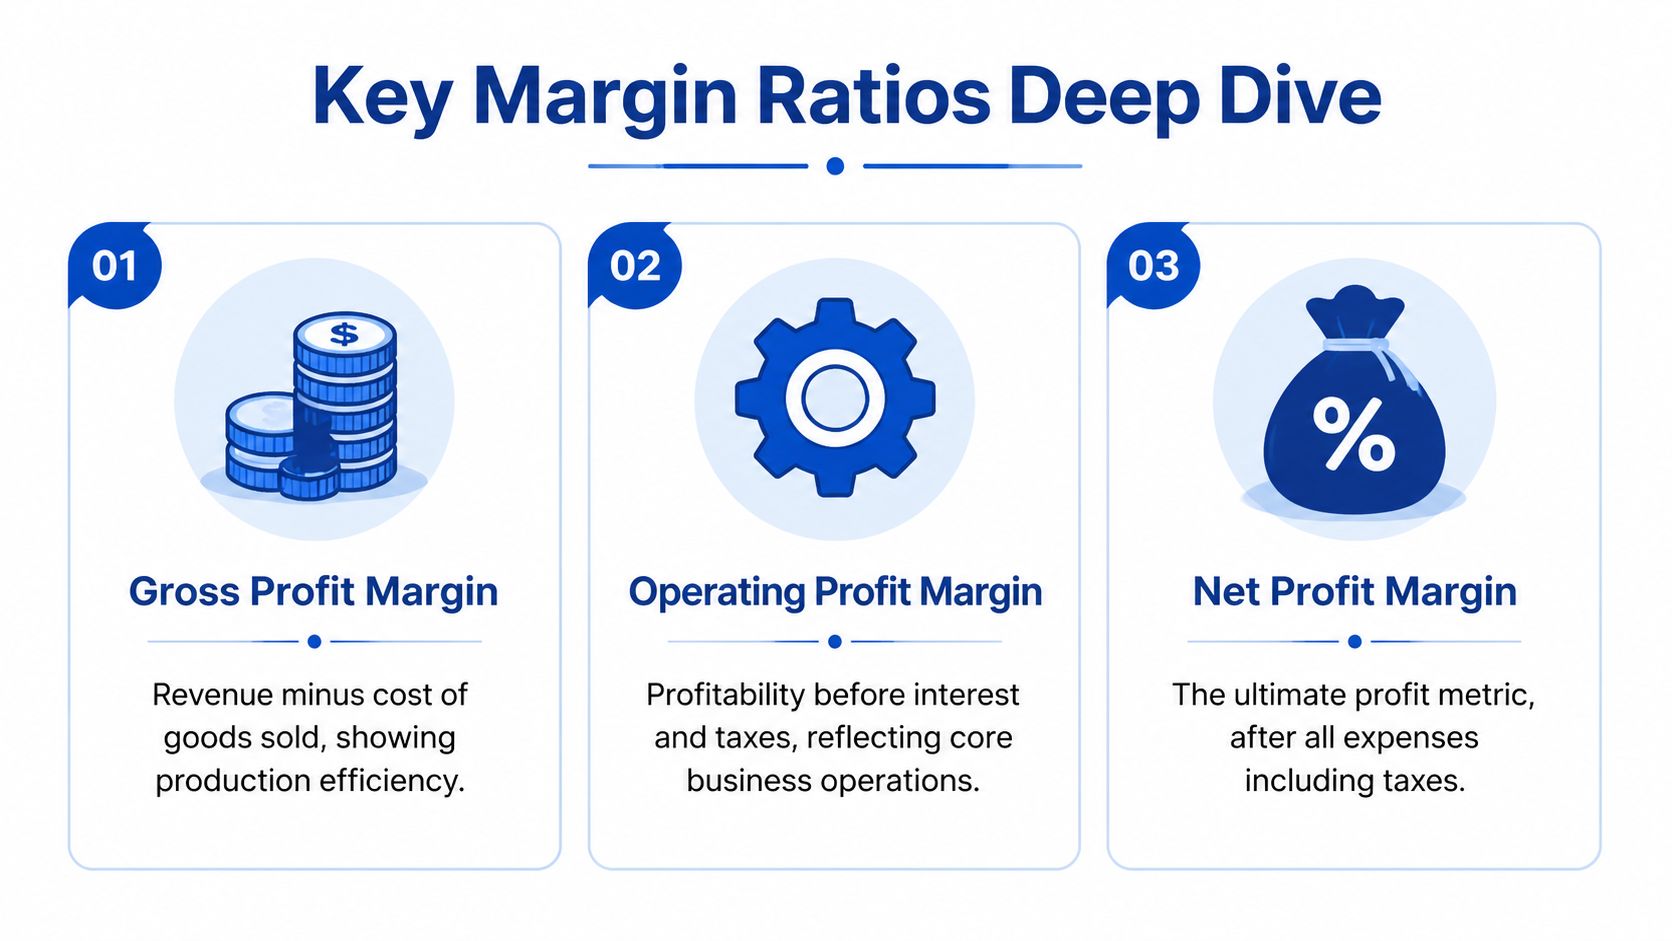
| Gross Profit Margin | Gross Profit ÷ Revenue | How much revenue remains after direct service delivery costs |
| Operating Profit Margin | Operating Profit ÷ Revenue | How efficiently core operations run after overhead |
| Net Profit Margin | Net Income ÷ Revenue | What percentage of revenue becomes bottom-line profit |
| Contribution Margin | Revenue minus variable costs, measured against revenue | How much revenue remains to cover fixed costs and profit |
If you want a more detailed explanation of the first ratio, this guide on how to calculate gross profit margin for a service business walks through the bookkeeping behind the formula.
Gross profit margin
Definition: Gross profit margin shows how much revenue is left after the direct costs required to deliver your service.
Formula:
Gross Profit ÷ Revenue
For a service firm, this is often the first place owners get turned around. “Cost of goods sold” sounds like a retail term, but service companies have an equivalent. It is usually direct cost of service. That can include billable payroll, contractor labor, and software tied directly to client delivery.
A marketing agency is a good example. If the agency collects retainers and project fees, then pays strategists, freelance designers, and paid media specialists to fulfill that work, the amount left after those direct costs is gross profit. Gross margin turns that amount into a percentage, so you can compare one month to another without getting distracted by raw dollars.
Gross margin works like the kitchen cost percentage in a restaurant. Before the owner worries about rent or admin staff, they need to know whether each plate sold leaves enough room after ingredients and prep labor. In a service business, the “ingredients” are usually labor hours and contractor cost.
InvoiceFly’s discussion of margin diagnostics notes that service businesses often see gross profit margin in the 50–70% range. Use that as a reference point, not a rule. A specialized consulting firm may run higher. A labor-intensive agency with heavy subcontractor use may run lower.
If your gross margin is slipping, the cause is usually close to the client work itself. Common reasons include underpriced engagements, too many hours spent on fixed-fee work, scope creep, rework, or inconsistent staffing.
One warning matters here. Gross margin is only useful if direct labor is posted consistently. If client-facing payroll sits in overhead one month and cost of service the next, the ratio stops helping.
Start with the delivery engine. Pricing, staffing mix, utilization, and scope control usually move gross margin more than office cuts do.
A short video can also help make the formulas easier to follow in context.
Operating profit margin
Definition: Operating profit margin shows what remains after direct service costs and operating expenses.
Formula:
Operating Profit ÷ Revenue
This ratio answers a different question. After you deliver the work profitably, is the company around that work sized correctly?
Operating expenses usually include administrative payroll, rent, insurance, recruiting, general software subscriptions, owner management costs, and other overhead. For many service businesses, these expenses can make growth expensive. Revenue rises, but so do account managers, project coordinators, subscriptions, leadership layers, and internal support costs.
Operating margin works like the amount of cargo a plane can still carry after accounting for the weight of the aircraft itself. If the structure gets too heavy, performance suffers even when the engine is strong. In business terms, you may be delivering client work well, but the company is carrying too much overhead.
InvoiceFly reports that operating margin commonly falls in the 10–20% range for service businesses. Based on that same InvoiceFly profitability guide, a company with healthy gross margin and weak operating margin often has an overhead issue, not a delivery issue.
That distinction matters. If you misread the problem, you may cut delivery staff when the actual issue is too much back-office spend or management bloat.
Net profit margin
Definition: Net profit margin shows the percentage of revenue left after all expenses, including taxes and financing costs.
Formula:
Net Income ÷ Revenue
This is the final scorecard.
Net margin tells you what remains for reinvestment, owner distributions, debt reduction, or cash reserves. It includes everything below operating profit, so it captures costs that do not show up in your day-to-day delivery model, such as loan interest or taxes.
A service business can look healthy at the gross margin level and still disappoint at the bottom line. That often happens when debt service is high, owner compensation is structured inconsistently, or tax planning has not kept up with growth.
Net margin is the ratio owners watch most closely. It should not be the only one they watch. By itself, it tells you the outcome, not the cause.
Contribution margin
Definition: Contribution margin shows how much revenue remains after variable costs, so that amount can cover fixed costs and profit.
This ratio is especially useful for service businesses making tactical decisions. Should you accept a lower-priced project to keep contractors utilized? Should you launch a new service line that needs freelance support before it justifies a full-time hire? Should you take on a client that needs heavy customization?
Contribution margin helps answer those questions because it focuses on the economics of one job, one client, or one service line. Variable costs often include contractor labor, project-specific software, and other costs that rise directly with the work performed.
That makes contribution margin a planning tool, not just a reporting tool.
Where owners mix these up
The mistake usually starts with classification, not math.
A client-facing strategist may belong in direct labor. An office manager usually belongs in operating expense. A freelancer assigned to a client project is often a direct cost. Your general accounting platform usually belongs in overhead. If those categories are inconsistent, the ratios can point you toward the wrong decision.
Use this mental model:
- Gross margin measures whether the work is profitable to deliver.
- Operating margin measures whether the business is carrying the right level of overhead.
- Net margin measures what remains after everything is counted.
- Contribution margin measures whether a specific job, client, or service line adds enough to cover fixed costs and profit.
For a service business owner, that is the primary value of margin analysis. Each ratio isolates a different layer of the business. Clean bookkeeping keeps those layers separate, which is what makes the numbers useful enough to act on.
Measuring Your Asset and Equity Efficiency
A consulting firm can post a healthy profit and still tie up too much cash in receivables, software subscriptions, or owner capital that is not earning enough in return.
That is what return ratios help you judge.

Margins answer, "Did we make money?" Return ratios answer, "Did we use what we have efficiently to make it?" For service businesses, that distinction matters because the asset base looks different from a product company. You usually do not have shelves full of inventory. You have cash, receivables, workstations, software, and a team that has to be paid on time.
Return on assets
Return on Assets, or ROA, measures how much profit the business produces from the assets on the balance sheet.
Formula:
Net Income ÷ Total Assets
For a marketing agency or advisory firm, assets often include cash, accounts receivable, laptops, office equipment, prepaid expenses, and certain software or implementation costs. Those items may look modest compared with a manufacturer’s asset base, but they still represent resources you had to fund.
ROA works like a productivity check on the balance sheet. If assets keep growing but profit does not keep pace, something is absorbing capital without producing enough return. In a service business, the usual suspects are slow collections, excess cash sitting idle, or technology spending that has not led to better utilization or pricing.
Xero’s guide to profitability ratios for service businesses notes that ROA is a useful way to assess whether those business resources are earning an acceptable return.
If the balance sheet accounts behind that formula still feel fuzzy, this guide on how to read a balance sheet will make ROA much easier to interpret.
Return on equity
Return on Equity, or ROE, measures how much profit the company generates compared with the owners’ equity.
Formula:
Net Income ÷ Shareholders’ Equity
Equity is the owner’s stake in the business. For a service company, that usually includes money invested into the company, profits left in the business over time, and the effect of owner distributions. ROE answers a practical question many owners rarely state directly: if I keep capital in this business instead of taking it out, am I getting a strong enough return for that choice?
That question becomes more important as the firm matures. Maybe you retained earnings to hire senior staff, expand into a new service line, or build out systems. ROE helps you judge whether those decisions are creating value or just increasing the amount of capital trapped in the business.
ROE also deserves careful reading in owner-operated companies because distributions, prior-year cleanup entries, and inconsistent equity postings can distort it fast. If bookkeeping in the equity section is sloppy, the ratio may look stronger or weaker than reality.
Strong profit on paper does not help much if receivables are slow and payroll is due every two weeks.
As noted earlier in Xero’s service business guide, cash flow margin should be reviewed alongside return ratios. That is especially true for firms that invoice monthly, wait to collect, and carry a heavy payroll burden in the meantime.
Why return ratios change owner decisions
Return ratios are useful because they connect accounting results to capital allocation.
A healthy net margin might suggest the business is doing well. ROA can reveal that receivables are creeping up and dragging efficiency down. ROE can show that profits retained for growth are not producing enough return yet. Those are different problems, and they lead to different decisions.
For a service business owner, the ratios find their practical application. They can help you decide whether to tighten collections, reduce idle cash, pause software spending, or rethink how much capital should stay in the company.
They also depend heavily on clean books. If accounts receivable is overstated, prepaid expenses are misclassified, or owner distributions are mixed into expenses, both ROA and ROE lose credibility. Accurate bookkeeping is what turns these formulas from interesting math into useful management tools.
How to Interpret Your Ratios Like a CFO
It is the third week of the month. Your agency just closed a strong batch of client work, revenue looks solid, and payroll is coming up again. On the surface, the business feels healthy. Then you review your margins and notice operating profit is thinning even though top-line sales have held up.
That is how a CFO reads the numbers. Revenue starts the conversation. Ratios show where the money is staying, and where it is leaking out.

Read the full chain of margins
For a service business, profitability ratios work like a set of filters.
Gross margin shows what is left after the direct cost of delivering the work. In a consulting firm or marketing agency, that usually means billable payroll, contractors, and other delivery costs. Operating margin shows what remains after overhead such as admin salaries, rent, software, and management expenses. Net margin shows what survives after everything else, including interest and taxes.
The distance between those margins matters as much as the final number.
If gross margin looks healthy but operating margin keeps shrinking, overhead is likely growing faster than the business can support. If operating margin is respectable but net margin is weak, the pressure may be outside core operations. If gross margin is soft from the start, the problem usually sits inside pricing, utilization, scope control, or labor efficiency.
A CFO reads those gaps the way a doctor reads blood pressure, pulse, and temperature together. One number helps. The pattern is what leads to a decision.
Use a practical diagnostic lens
A simple monthly review can answer the question behind every ratio change: what caused it?
Strong gross margin, weaker operating margin
Client work is probably priced reasonably, but overhead is taking too much of the benefit. Review non-billable payroll, software subscriptions, office costs, and management layers.Healthy operating margin, weaker net margin
The service model is performing, but interest, taxes, or other non-operating items are cutting into the bottom line.Weak gross margin
Start with delivery economics. Review realization, scope creep, contractor mix, write-offs, and whether your team is spending too many hours to produce the same revenue.Margins drifting down over several months
Small changes often show up here before they create a cash problem. Rising payroll burden, lower utilization, or gradual expense creep can subtly compress profits.
For service firms, this kind of review is more useful than a generic benchmark. A low-inventory business lives and dies by labor efficiency, pricing discipline, and clean cost classification.
Compare trendlines before chasing benchmarks
Peer comparisons can help, but they can also mislead.
A consulting firm may post a lower net margin than another firm because it is investing in senior hires, building delivery capacity, or carrying temporary onboarding costs. Another firm may show a better margin for one quarter because owner compensation, bonuses, or project costs were booked inconsistently.
Trendlines usually answer better questions. Is your margin improving as you raise rates? Did operating margin weaken after adding account managers? Are contractor costs climbing faster than client fees?
That is the level of analysis owners need if they want to understand AI digital transformation and other investments in terms of profit impact, not just strategy language.
Good interpretation depends on good bookkeeping
The same ratio can point to two very different conclusions depending on how the books are set up.
If direct labor is mixed with overhead, gross margin looks better than it really is. If owner expenses run through the P&L, net margin becomes harder to trust. If revenue is posted inconsistently across months, trend analysis loses much of its value.
CFO-style interpretation starts with clean classification and then asks sharper questions. Are we pricing correctly? Is delivery efficient? Is overhead growing on purpose, or by accident?
For a busy service business owner, that is the value of profitability ratios. They turn financial statements from a scorekeeping tool into a decision tool.
The 'Garbage In Garbage Out' Problem in Your Books
Profitability ratios only work if the underlying bookkeeping is right.
That sounds obvious, but good analysis often breaks down here. Owners calculate gross margin, operating margin, and net margin from reports that look clean on the surface but contain miscategorized transactions, stale entries, or a chart of accounts that doesn’t reflect how the business operates.
How bad bookkeeping distorts good analysis
A few common examples:
Direct labor booked as overhead
Gross margin looks artificially strong, while operating margin looks weaker than it really is.Owner spending mixed into business expenses
Net profit becomes noisy and hard to compare month to month.Revenue recorded inconsistently
One month looks unusually strong, the next looks weak, and neither tells the truth about underlying performance.Contractor costs lumped into generic expense categories
You lose visibility into service delivery economics and can’t tell whether client work is priced correctly.
This is why owners sometimes think they have a pricing problem when they really have a bookkeeping problem.
Clean books create usable ratios
A good chart of accounts should separate direct service costs from operating overhead clearly. Reconciliations should be current. Payroll allocations should reflect how labor is used. Contractor payments should land in the right place. Revenue should be recorded consistently.
When that foundation is missing, the ratios don’t just become less precise. They become misleading.
If your reports have been inconsistent for months or years, professional bookkeeping cleanup services can make the difference between guessing and knowing. The goal isn't prettier reports. The goal is dependable decisions.
A ratio is only as trustworthy as the transaction coding behind it.
Actionable Steps to Improve Your Profitability
Once you know where the pressure is, the next move is operational. Ratios help you diagnose. They don’t fix the business by themselves.
If gross margin is weak
Start with delivery economics.
Tighten scope before you raise prices broadly. Many service firms lose margin because work gradually expands after the proposal is signed. Review statements of work, change-order habits, and utilization patterns. If premium staff are doing junior-level tasks, your labor model may be the leak.
You should also look at service mix. Some offers create more effort than they’re worth. If one line of work constantly generates revisions, custom requests, or poor handoffs, it may be dragging gross margin down.
If operating margin is under pressure
Look for overhead that expanded faster than discipline.
That often includes duplicate software tools, underused subscriptions, management layers added too early, or administrative processes that haven’t kept pace with growth. Service businesses often accept these costs one by one because each seems small. Together, they can compress operating margin materially.
A smart place to look is process design. If you're trying to understand AI digital transformation in practical terms, focus on whether automation reduces repetitive admin work, improves handoffs, or shortens reporting cycles. Technology only helps profitability when it changes workflow, not when it adds another monthly fee.
If net margin is disappointing
Review what sits below operations.
Tax planning, financing structure, and owner compensation design all affect the final result. If the business runs well operationally but the bottom line still disappoints, the answer may be outside day-to-day service delivery.
Use a short review checklist:
- Reprice selectively for clients or services that consume more labor than expected.
- Tighten project controls so scope creep doesn’t leak margin.
- Cut tool sprawl by reviewing software subscriptions and overlap.
- Improve collections so profit turns into usable cash faster.
- Review staffing mix to make sure labor cost matches the complexity of the work.
The best improvement plan is targeted. Don’t cut blindly. Match the action to the ratio that needs help.
How Steingard Financial Builds Your Profitability Engine
A consulting firm closes a month feeling busy, fully booked, and reasonably confident. Then the margin report comes in and the numbers do not match the effort. In service businesses, that gap usually starts in the books before it shows up in the ratios.
Profitability ratios only work when the accounting is built to reflect how a service firm earns money. That means revenue recorded in the right period, labor costs classified correctly, and a chart of accounts that clearly separates direct client work from overhead. If those pieces are off, gross margin can look stronger than it is, operating margin can look weaker than it should, and owners can make the wrong call on hiring, pricing, or spending.
Speed matters too.
A clean report delivered six weeks late is like a dashboard that updates after you miss the turn. Service business owners need numbers while they can still fix the issue, whether that issue is a project running over budget, contractor costs creeping up, or payroll rising faster than billable work.
For agencies, consultancies, and other labor-heavy firms, people costs are usually the main driver of profitability. Small bookkeeping choices matter here more than many owners realize. If payroll is lumped together without clear allocation, if contractor costs are mixed with overhead, or if client reimbursements are posted inconsistently, the ratios stop being decision tools and start becoming noise.
Steingard Financial helps build the system behind the ratios, not just the monthly report. That includes cleaning up bookkeeping, tightening reconciliations, organizing accounts so service margins are visible, and setting up reporting that gives owners a useful read on performance. They also support payroll and people operations through tools like QuickBooks and Gusto, which matters because labor accuracy sits at the center of service business profitability.
The result is practical. You can see which services earn healthy margins, which clients absorb too much time, and whether overhead is growing in line with revenue. Ratios become less like academic formulas and more like gauges on an engine panel. Once the gauges are reliable, decisions get easier.
Better books lead to better ratios. Better ratios lead to better business decisions.
If you want reporting that helps you run the business with more clarity, Steingard Financial is built to support that work.
Frequently Asked Questions About Profitability Ratios
How often should I calculate profitability ratios?
For most service businesses, monthly is the best rhythm.
Monthly review gives you enough frequency to catch problems before they become expensive. Quarterly can work for very stable businesses, but many firms wait too long and lose the chance to respond quickly to margin drift, rising overhead, or slower collections.
Which profitability ratio should I look at first?
Start with gross profit margin, then operating margin, then net profit margin.
That order helps you diagnose problems in sequence. If you jump straight to net margin, you may see the symptom without knowing where the issue started.
Are profitability ratios different for service businesses?
The formulas are the same, but the cost structure is different.
Service firms usually have low inventory and high labor dependence. That means direct labor classification, contractor accounting, payroll allocation, and software spend matter a lot. A small categorization error can distort the story quickly.
Can I be profitable on paper and still have cash problems?
Yes. Absolutely.
A company can show net profit and still struggle with cash because clients pay late, receivables build up, or expenses hit before collections arrive. That’s why owners should review profitability and cash flow together rather than treating them as the same thing.
What if I don’t trust my current books?
Then fix the books before you trust the ratios.
A beautiful dashboard built on messy bookkeeping is still unreliable. If expenses are miscategorized or revenue timing is inconsistent, your conclusions may be wrong even if the formulas are correct.
What’s the main benefit of learning what are profitability ratios?
Clarity.
You stop managing by intuition alone. You start seeing whether problems come from pricing, labor efficiency, overhead, financing, or capital use. That makes your decisions faster and more grounded.
If you want clean books, timely reporting, and profitability insights you can use, Steingard Financial helps service businesses build that foundation. Their team supports bookkeeping, payroll, reporting, and people operations so you can stop guessing at margins and start managing with confidence.